
First Quarter 2021 Investor Presentation MAY 2021
Disclaimer 2 Forward-Looking Statements This presentation contains forward-looking statements. These forward-looking statements reflect our current views with respect to, among other things, future events and our financial performance. These statements are often, but not always, made through the use of words or phrases such as “may,” “should,” “could,” “predict,” “potential,” “believe,” “will likely result,” “expect,” “continue,” “will,” “anticipate,” “seek,” “estimate,” “intend,” “plan,” “projection,” “would” and “outlook,” or the negative version of those words or other comparable words or phrases of a future or forward-looking nature. These forward-looking statements are not historical facts and are based on current expectations, estimates and projections about our industry, management’s beliefs and certain assumptions made by management, many of which, by their nature, are inherently uncertain and beyond our control. Accordingly, we caution you that any such forward-looking statements are not guarantees of future performance and are subject to risks, assumptions and uncertainties that are difficult to predict. Although we believe that the expectations reflected in these forward-looking statements are reasonable as of the date made, actual results may prove to be materially different from the results expressed or implied by the forward-looking statements. Important factors that could cause our actual results to differ materially from those indicated in these forward-looking statements include, but are not limited to, the risks, uncertainties and factors that are set forth under Item IA. – Risk Factors and all other disclosures appearing in Guild’s Annual Report on Form 10-K for the year ended December 31, 2020, as well as in other documents Guild files from time to time with the Securities and Exchange Commission. The foregoing factors should not be construed as exhaustive and should be read together with the other cautionary statements included in this press release. If one or more events related to these or other risks or uncertainties materialize, or if our underlying assumptions prove to be incorrect, actual results may differ materially from what we anticipate. Many of the important factors that will determine these results are beyond our ability to control or predict. Accordingly, you should not place undue reliance on any such forward- looking statements. Any forward-looking statement speaks only as of the date on which it is made, and, except as otherwise required by law, we do not undertake any obligation to publicly update or review any forward-looking statement, whether as a result of new information, future developments or otherwise. New factors emerge from time to time, and it is not possible for us to predict which will arise. In addition, we cannot assess the impact of each factor on our business or the extent to which any factor, or combination of factors, may cause actual results to differ materially from those contained in any forward-looking statements.
Overview of First Quarter 2021 Results 3 Q1 Highlights Generated GAAP net income of $161 million, or $2.67 per diluted share Adjusted net income was $106 million, or $1.77 per share1 Year-over-year increase in adjusted net income of 84% driven primarily by strong growth in origination volume and continued strength in gain on sale margins Net revenue increased more than 200% year-over-year to $526 million Adjusted EBITDA totaled $144.3 million, up 76% year-over-year1 Total in-house originations of $9.8 billion, up 70% year-over-year Purchase loans represented 37% of total in-house originations Gain on sale margin of 4.57% based on in-house originations and 4.80% based on pull through adjusted locked volume Maintained a strong liquidity profile with $316 million of cash, $1.0 billion of unutilized warehouse capacity and $146.1 million of undrawn borrowing capacity on MSR financing line In conjunction with first quarter earnings, we announced the acquisition of Residential Mortgage Services Holdings (“RMS”), a leading retail, purchase-focused originator based in the northeast 1. See appendix page 24 for reconciliation of non-GAAP measures.
Overview of First Quarter 2021 Results (continued) 4 Origination Segment Net income for the origination segment increased 133% year-over-year to $160 million, driven primarily by strong origination volume and gain on sale margins 9% year-over-year increase in gain on sale margin based on in-house originations to 4.57% 61% year-over-year increase in gain on sale margin based on pull-through adjusted locked volume to 4.80% Year-over-year, net revenue for the segment increased 86% to $448 million while expenses increased 67% to $288 million Expenses as a percent of net revenue improved from 71% in Q1 2020 to 64% in Q1 2021 Servicing Segment Net income for the servicing segment totaled $67 million compared to a loss of $79 million in the prior year In-house servicing portfolio increased 25% to $62.9 billion; retained servicing rights on 94% of loans sold Servicing portfolio leverage ended the quarter at 28% with $165 million of borrowings and a fair value of $587 million Recaptured 69% of refinance opportunities, highlighting the power of Guild’s symbiotic business model 2.9% of servicing portfolio loans were in forbearance as of quarter end, approximately 2% less than the industry average of 4.9% as reported by the Mortgage Bankers Association
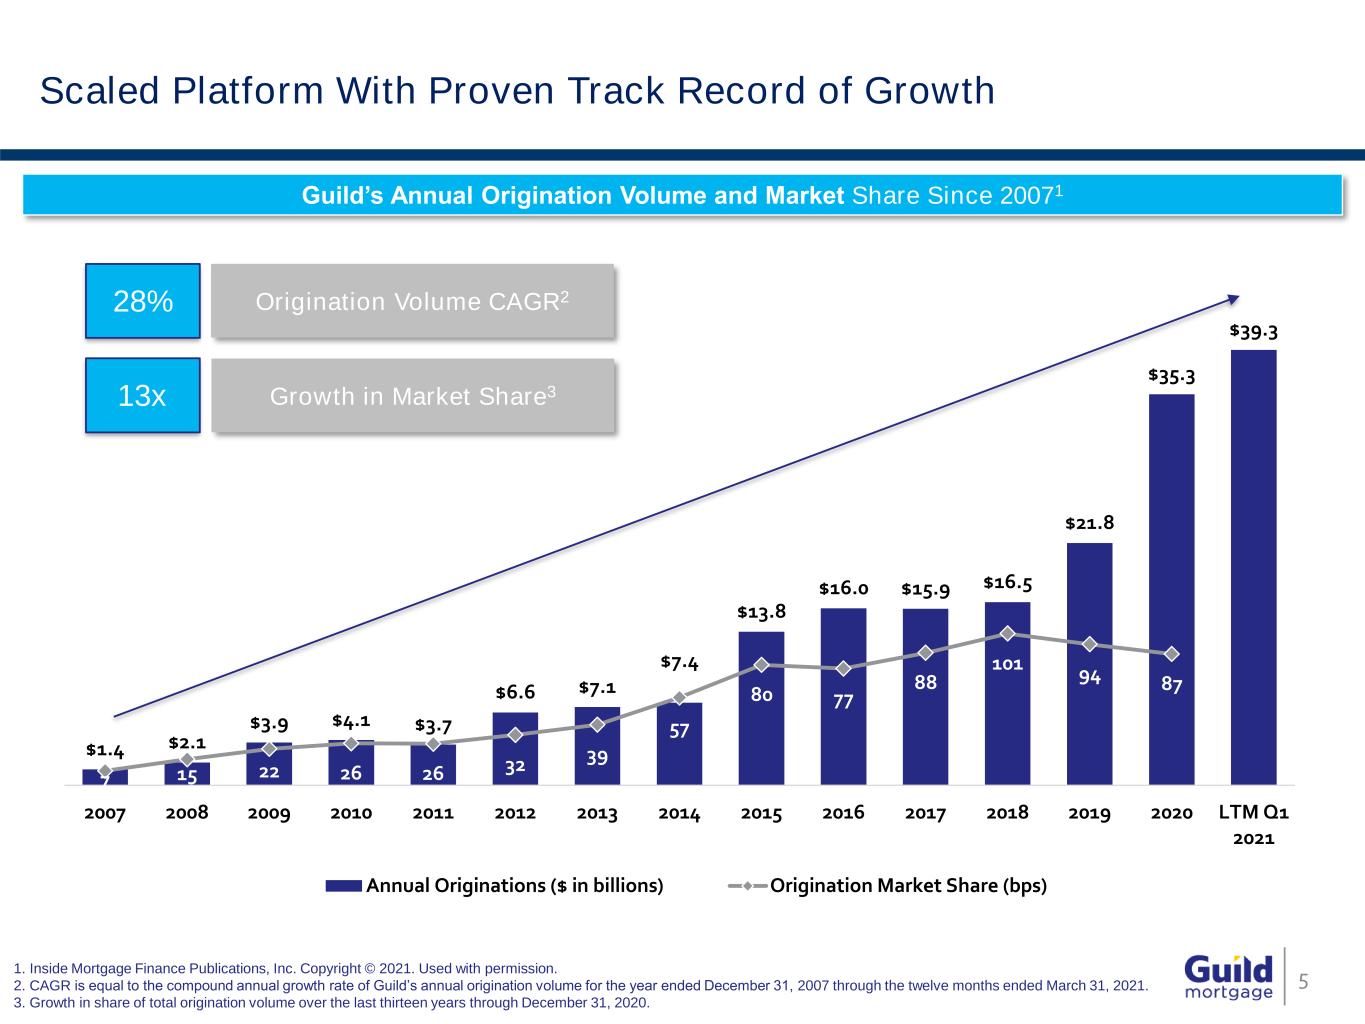
$1.4 $2.1 $3.9 $4.1 $3.7 $6.6 $7.1 $7.4 $13.8 $16.0 $15.9 $16.5 $21.8 $35.3 $39.3 7 15 22 26 26 32 39 57 80 77 88 101 94 87 2007 2008 2009 2010 2011 2012 2013 2014 2015 2016 2017 2018 2019 2020 LTM Q1 2021 Annual Originations ($ in billions) Origination Market Share (bps) Growth in Market Share3 Scaled Platform With Proven Track Record of Growth 1. Inside Mortgage Finance Publications, Inc. Copyright © 2021. Used with permission. 2. CAGR is equal to the compound annual growth rate of Guild’s annual origination volume for the year ended December 31, 2007 through the twelve months ended March 31, 2021. 3. Growth in share of total origination volume over the last thirteen years through December 31, 2020. 5 Guild’s Annual Origination Volume and Market Share Since 20071 28% 13x Origination Volume CAGR2
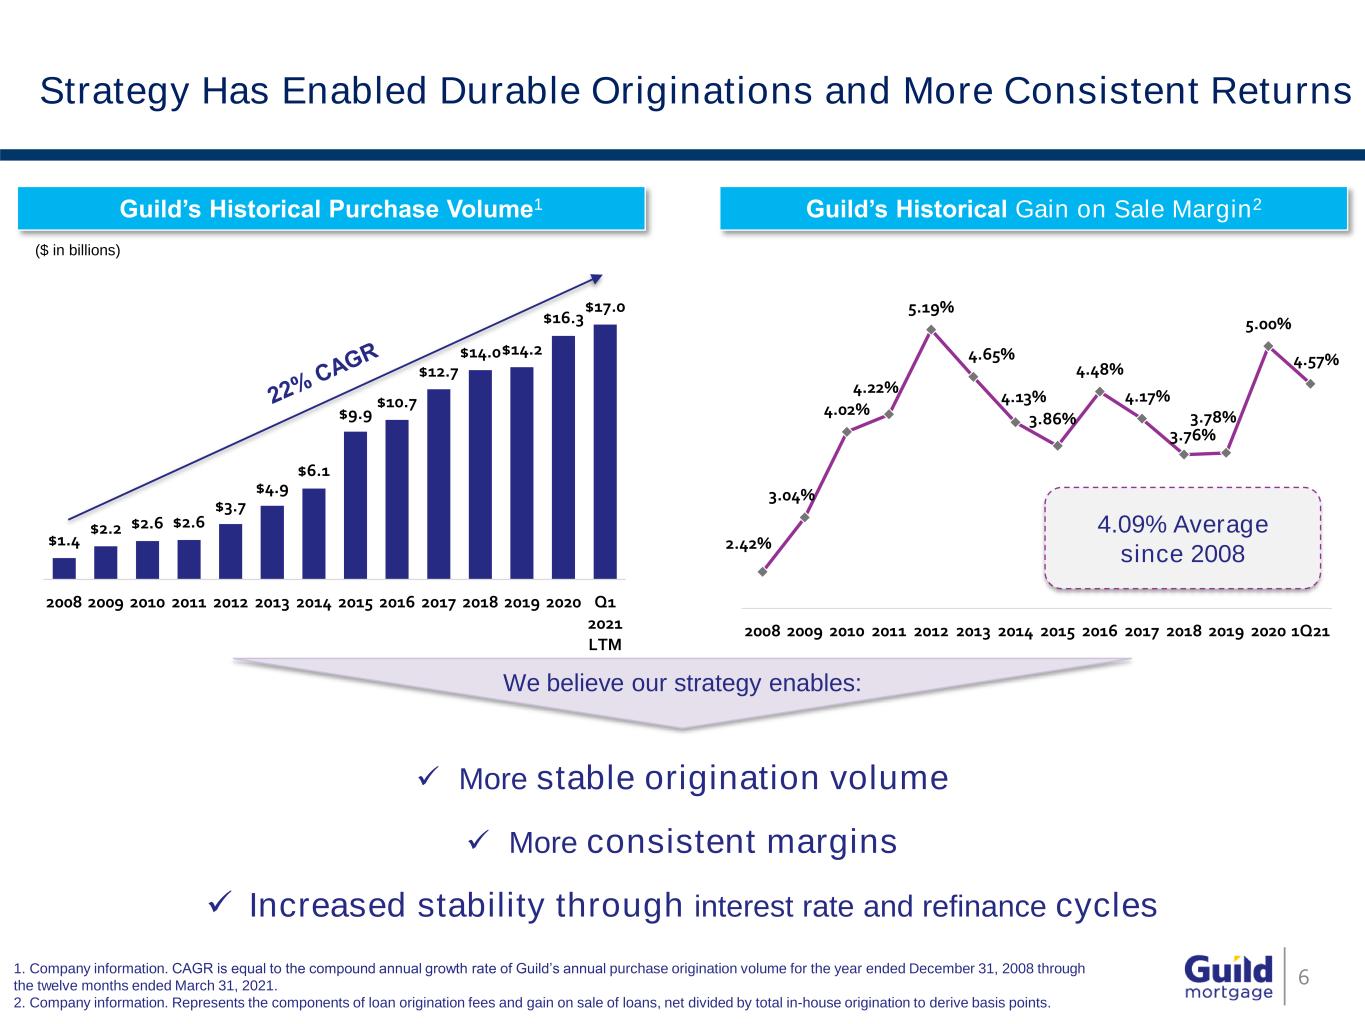
2.42% 3.04% 4.02% 4.22% 5.19% 4.65% 4.13% 3.86% 4.48% 4.17% 3.76% 3.78% 5.00% 4.57% 2008 2009 2010 2011 2012 2013 2014 2015 2016 2017 2018 2019 2020 1Q21 Guild’s Historical Gain on Sale Margin2 Strategy Has Enabled Durable Originations and More Consistent Returns 1. Company information. CAGR is equal to the compound annual growth rate of Guild’s annual purchase origination volume for the year ended December 31, 2008 through the twelve months ended March 31, 2021. 2. Company information. Represents the components of loan origination fees and gain on sale of loans, net divided by total in-house origination to derive basis points. 6 $1.4 $2.2 $2.6 $2.6 $3.7 $4.9 $6.1 $9.9 $10.7 $12.7 $14.0 $14.2 $16.3 $17.0 2008 2009 2010 2011 2012 2013 2014 2015 2016 2017 2018 2019 2020 Q1 2021 LTM ($ in billions) Guild’s Historical Purchase Volume1 More stable origination volume More consistent margins Increased stability through interest rate and refinance cycles 4.09% Average since 2008 We believe our strategy enables:

Residential Mortgage Services Holdings Transaction Overview 7
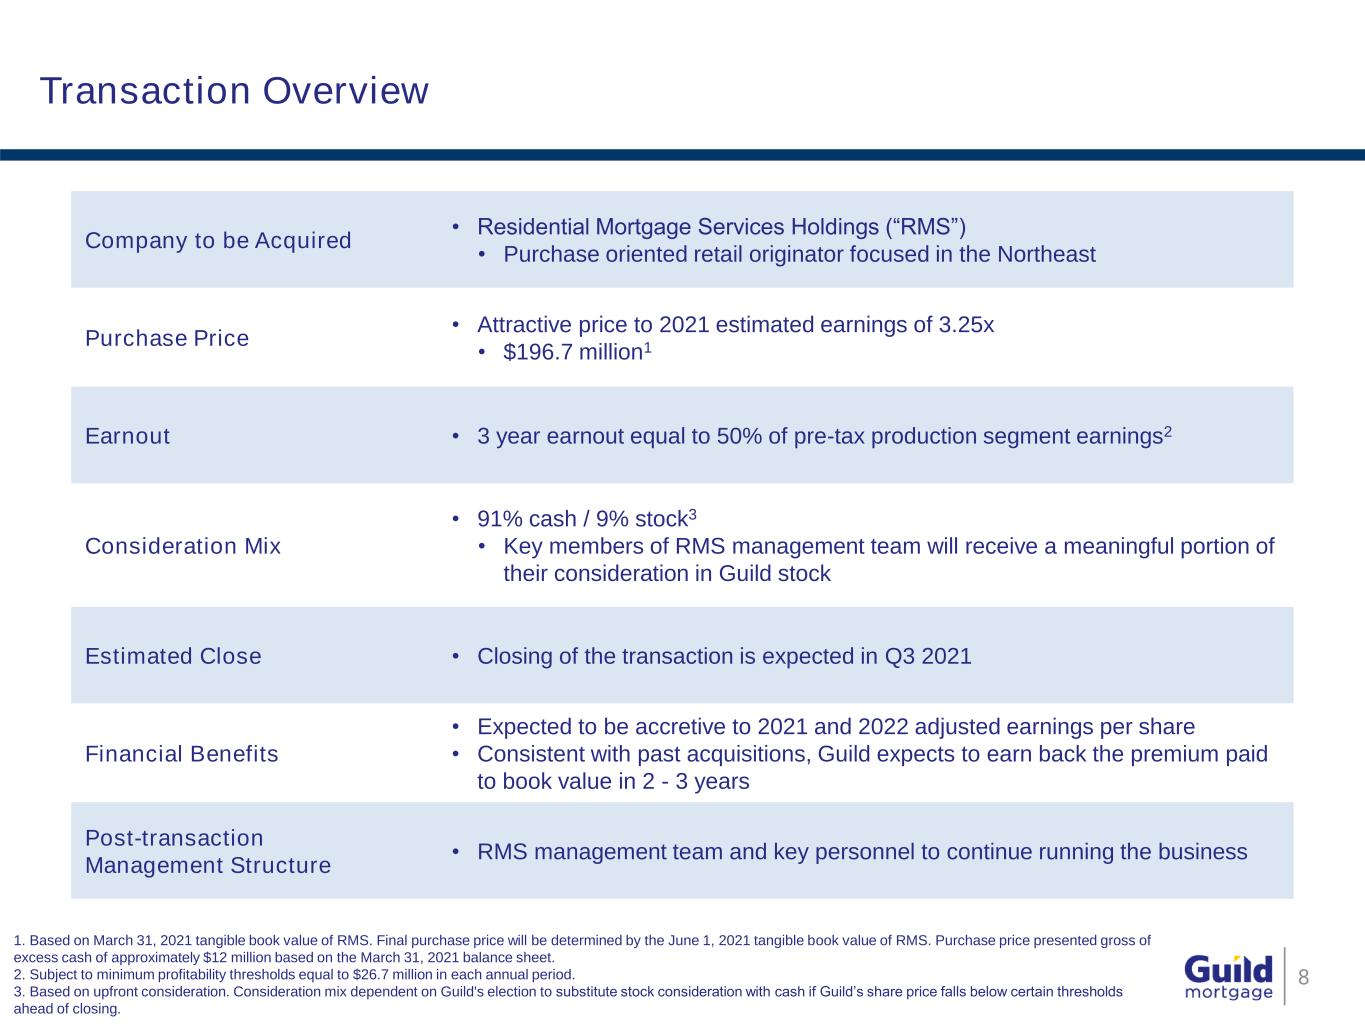
Transaction Overview 8 Company to be Acquired • Residential Mortgage Services Holdings (“RMS”) • Purchase oriented retail originator focused in the Northeast Purchase Price • Attractive price to 2021 estimated earnings of 3.25x • $196.7 million1 Earnout • 3 year earnout equal to 50% of pre-tax production segment earnings2 Consideration Mix • 91% cash / 9% stock3 • Key members of RMS management team will receive a meaningful portion of their consideration in Guild stock Estimated Close • Closing of the transaction is expected in Q3 2021 Financial Benefits • Expected to be accretive to 2021 and 2022 adjusted earnings per share • Consistent with past acquisitions, Guild expects to earn back the premium paid to book value in 2 - 3 years Post-transaction Management Structure • RMS management team and key personnel to continue running the business 1. Based on March 31, 2021 tangible book value of RMS. Final purchase price will be determined by the June 1, 2021 tangible book value of RMS. Purchase price presented gross of excess cash of approximately $12 million based on the March 31, 2021 balance sheet. 2. Subject to minimum profitability thresholds equal to $26.7 million in each annual period. 3. Based on upfront consideration. Consideration mix dependent on Guild's election to substitute stock consideration with cash if Guild’s share price falls below certain thresholds ahead of closing.
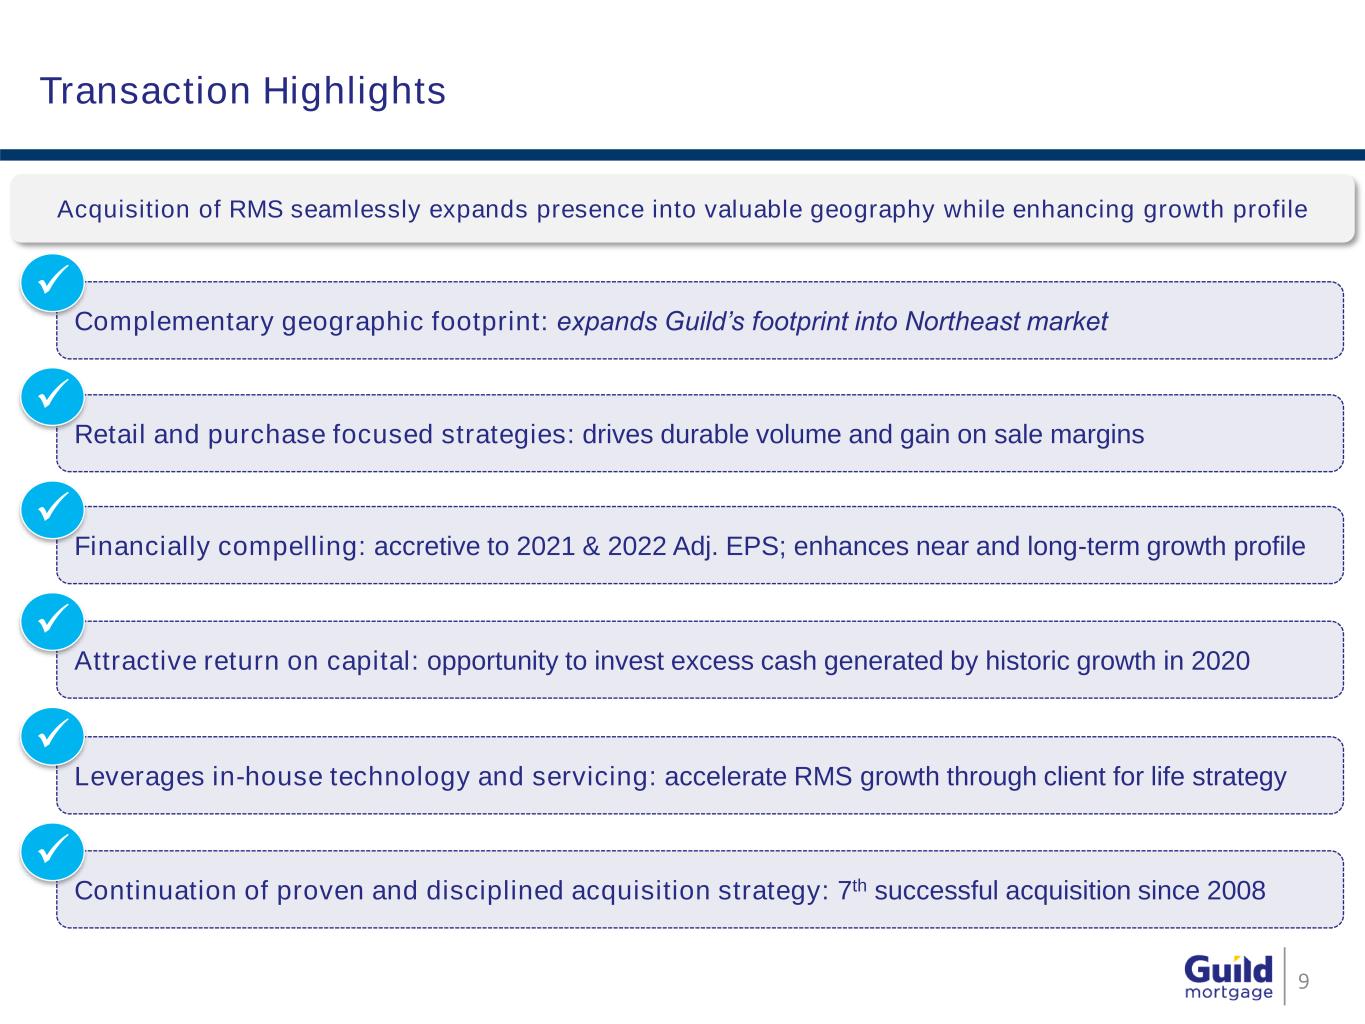
Transaction Highlights 9 Acquisition of RMS seamlessly expands presence into valuable geography while enhancing growth profile Complementary geographic footprint: expands Guild’s footprint into Northeast market Leverages in-house technology and servicing: accelerate RMS growth through client for life strategy Retail and purchase focused strategies: drives durable volume and gain on sale margins Financially compelling: accretive to 2021 & 2022 Adj. EPS; enhances near and long-term growth profile Attractive return on capital: opportunity to invest excess cash generated by historic growth in 2020 Continuation of proven and disciplined acquisition strategy: 7th successful acquisition since 2008
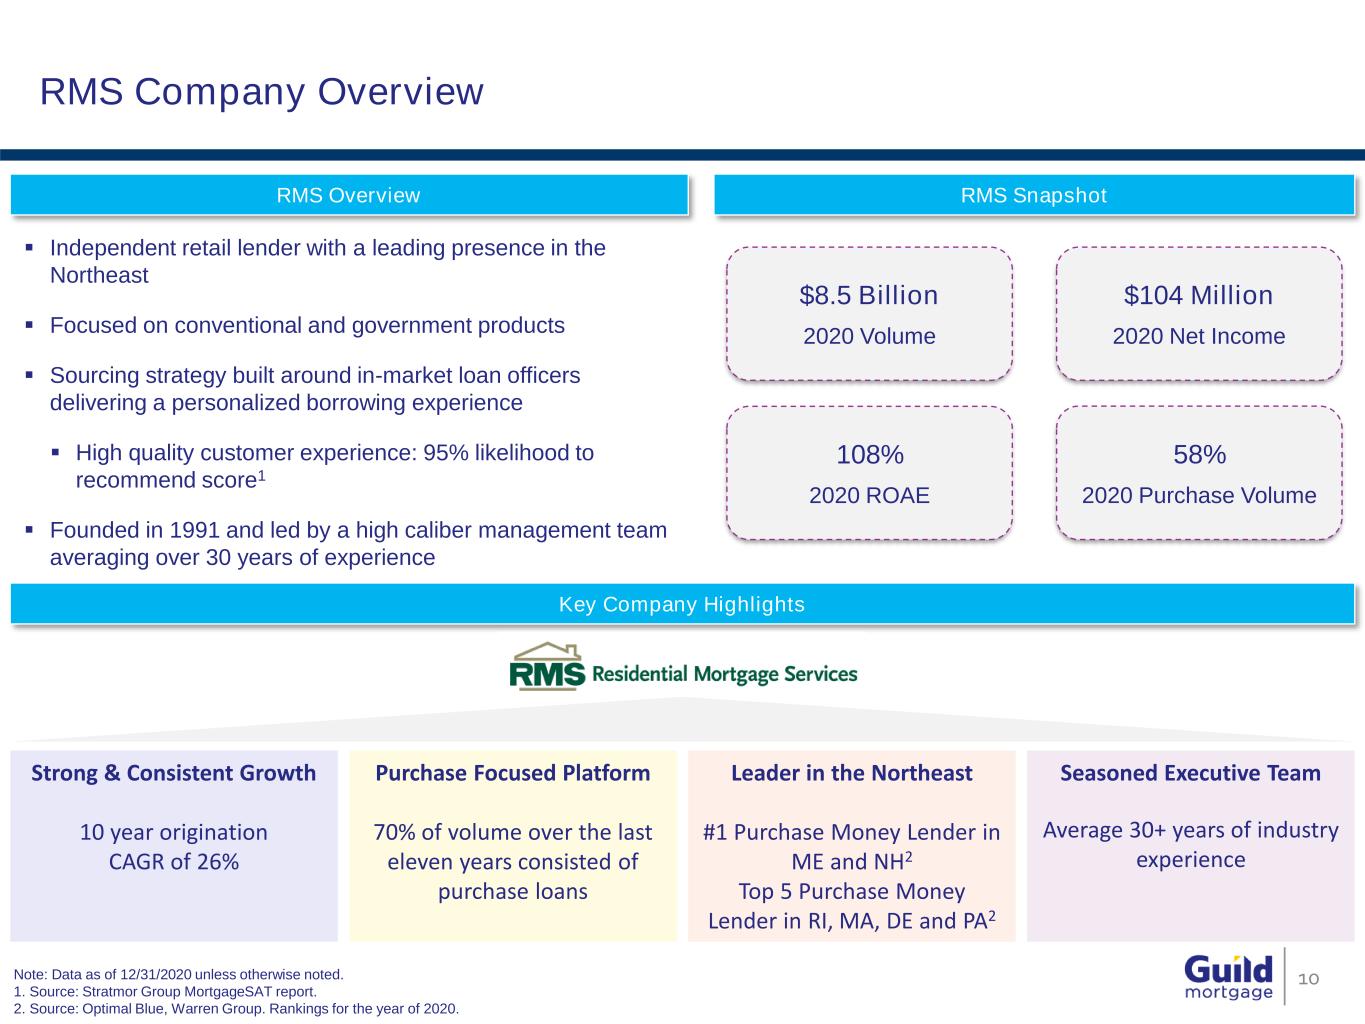
RMS Company Overview 10Note: Data as of 12/31/2020 unless otherwise noted. 1. Source: Stratmor Group MortgageSAT report. 2. Source: Optimal Blue, Warren Group. Rankings for the year of 2020. Independent retail lender with a leading presence in the Northeast Focused on conventional and government products Sourcing strategy built around in-market loan officers delivering a personalized borrowing experience High quality customer experience: 95% likelihood to recommend score1 Founded in 1991 and led by a high caliber management team averaging over 30 years of experience Key Company Highlights $8.5 Billion 2020 Volume $104 Million 2020 Net Income 108% 2020 ROAE 58% 2020 Purchase Volume Strong & Consistent Growth 10 year origination CAGR of 26% Seasoned Executive Team Average 30+ years of industry experience Leader in the Northeast #1 Purchase Money Lender in ME and NH2 Top 5 Purchase Money Lender in RI, MA, DE and PA2 Purchase Focused Platform 70% of volume over the last eleven years consisted of purchase loans RMS Overview RMS Snapshot
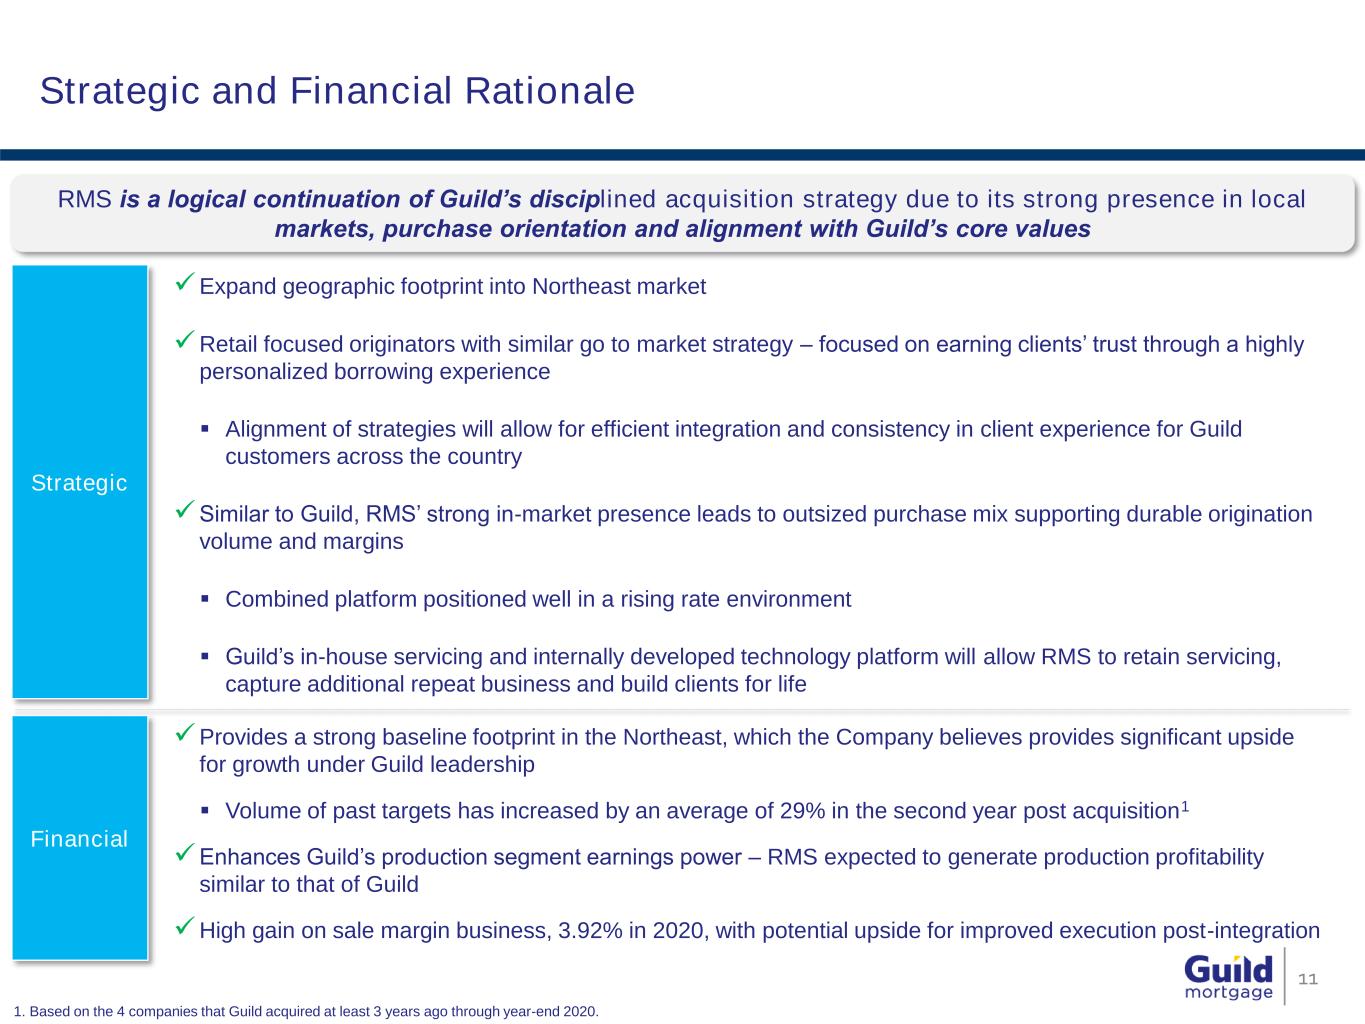
Strategic and Financial Rationale 11 Financial Strategic Expand geographic footprint into Northeast market Retail focused originators with similar go to market strategy – focused on earning clients’ trust through a highly personalized borrowing experience Alignment of strategies will allow for efficient integration and consistency in client experience for Guild customers across the country Similar to Guild, RMS’ strong in-market presence leads to outsized purchase mix supporting durable origination volume and margins Combined platform positioned well in a rising rate environment Guild’s in-house servicing and internally developed technology platform will allow RMS to retain servicing, capture additional repeat business and build clients for life Provides a strong baseline footprint in the Northeast, which the Company believes provides significant upside for growth under Guild leadership Volume of past targets has increased by an average of 29% in the second year post acquisition1 Enhances Guild’s production segment earnings power – RMS expected to generate production profitability similar to that of Guild High gain on sale margin business, 3.92% in 2020, with potential upside for improved execution post-integration RMS is a logical continuation of Guild’s disciplined acquisition strategy due to its strong presence in local markets, purchase orientation and alignment with Guild’s core values 1. Based on the 4 companies that Guild acquired at least 3 years ago through year-end 2020.
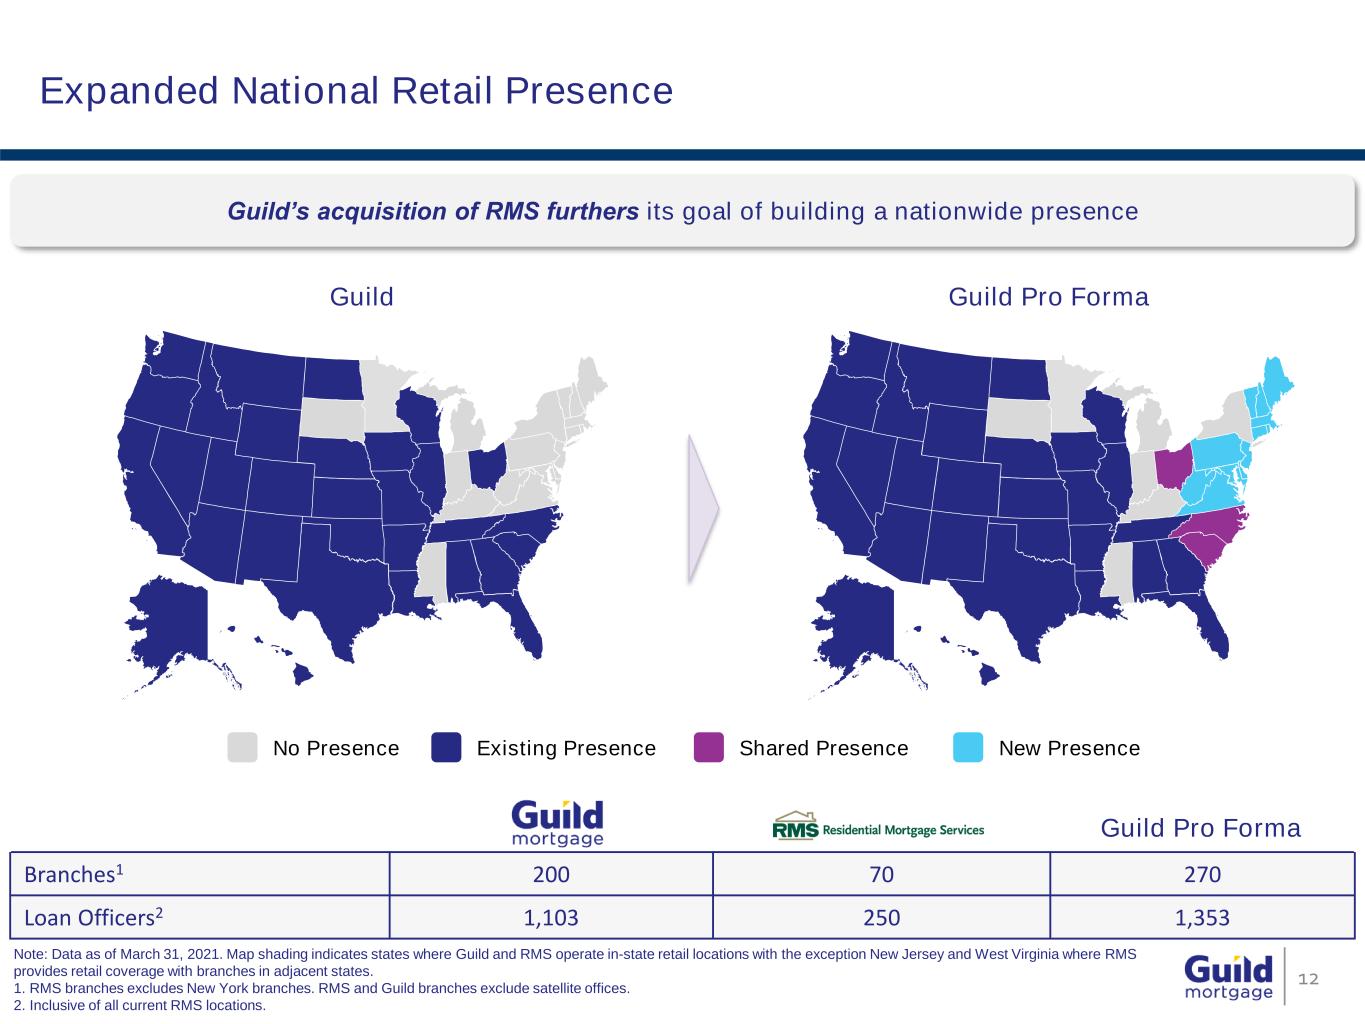
Expanded National Retail Presence Guild Guild Pro Forma 12 Note: Data as of March 31, 2021. Map shading indicates states where Guild and RMS operate in-state retail locations with the exception New Jersey and West Virginia where RMS provides retail coverage with branches in adjacent states. 1. RMS branches excludes New York branches. RMS and Guild branches exclude satellite offices. 2. Inclusive of all current RMS locations. Existing PresenceNo Presence Guild’s acquisition of RMS furthers its goal of building a nationwide presence New Presence Guild Pro Forma` Branches1 200 70 270 Loan Officers2 1,103 250 1,353 Shared Presence
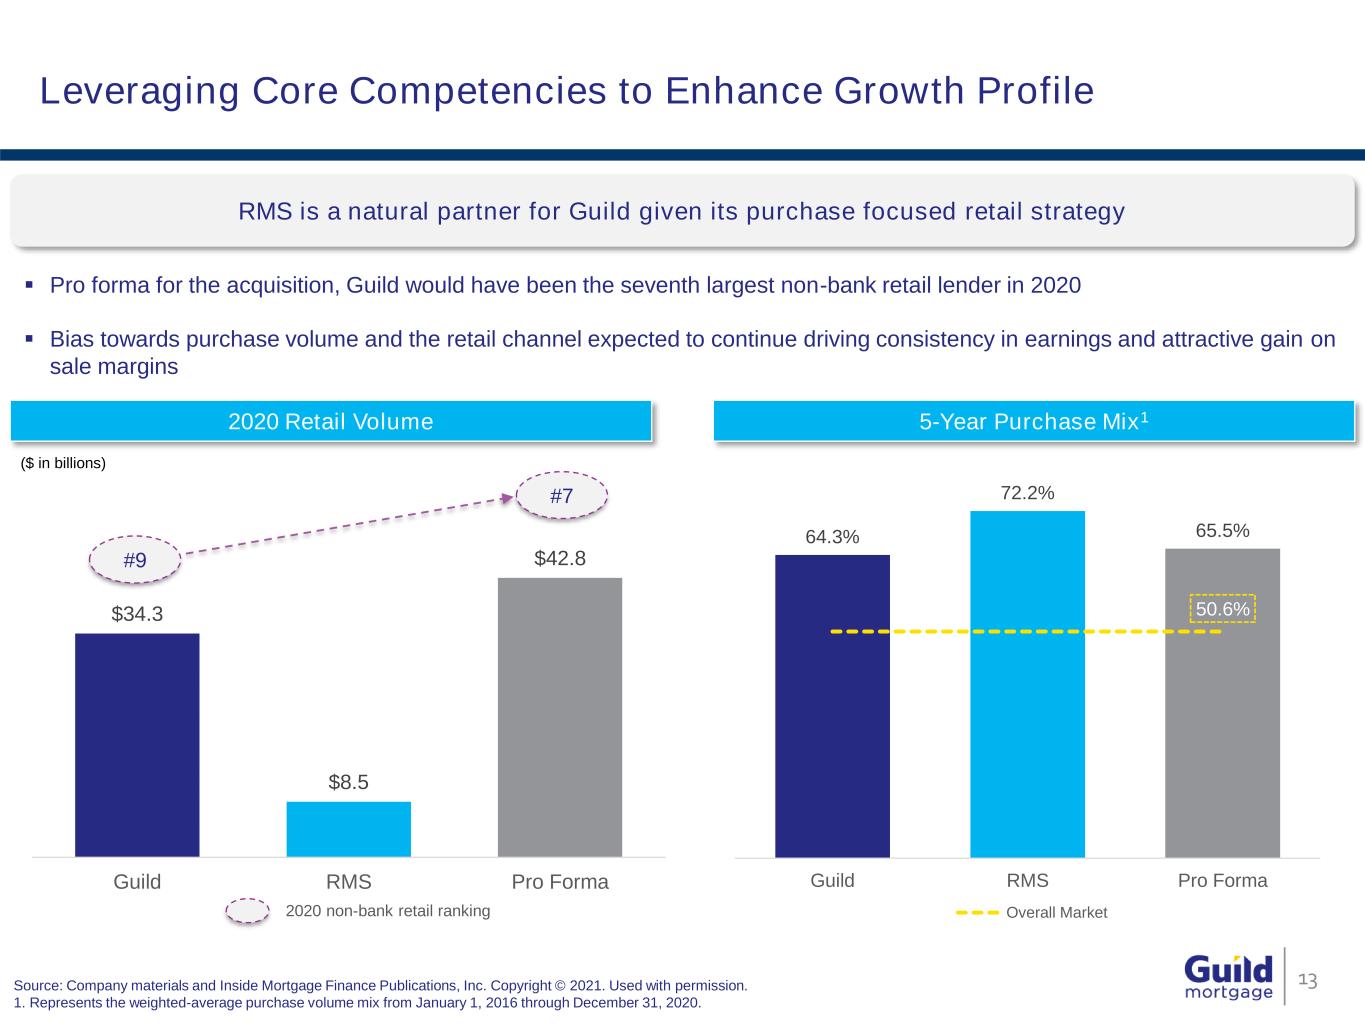
Leveraging Core Competencies to Enhance Growth Profile 13Source: Company materials and Inside Mortgage Finance Publications, Inc. Copyright © 2021. Used with permission. 1. Represents the weighted-average purchase volume mix from January 1, 2016 through December 31, 2020. RMS is a natural partner for Guild given its purchase focused retail strategy Pro forma for the acquisition, Guild would have been the seventh largest non-bank retail lender in 2020 Bias towards purchase volume and the retail channel expected to continue driving consistency in earnings and attractive gain on sale margins $34.3 $8.5 $42.8 Guild RMS Pro Forma 2020 Retail Volume 64.3% 72.2% 65.5% 50.6% Guild RMS Pro Forma Overall Market 5-Year Purchase Mix1 ($ in billions) #9 #7 2020 non-bank retail ranking
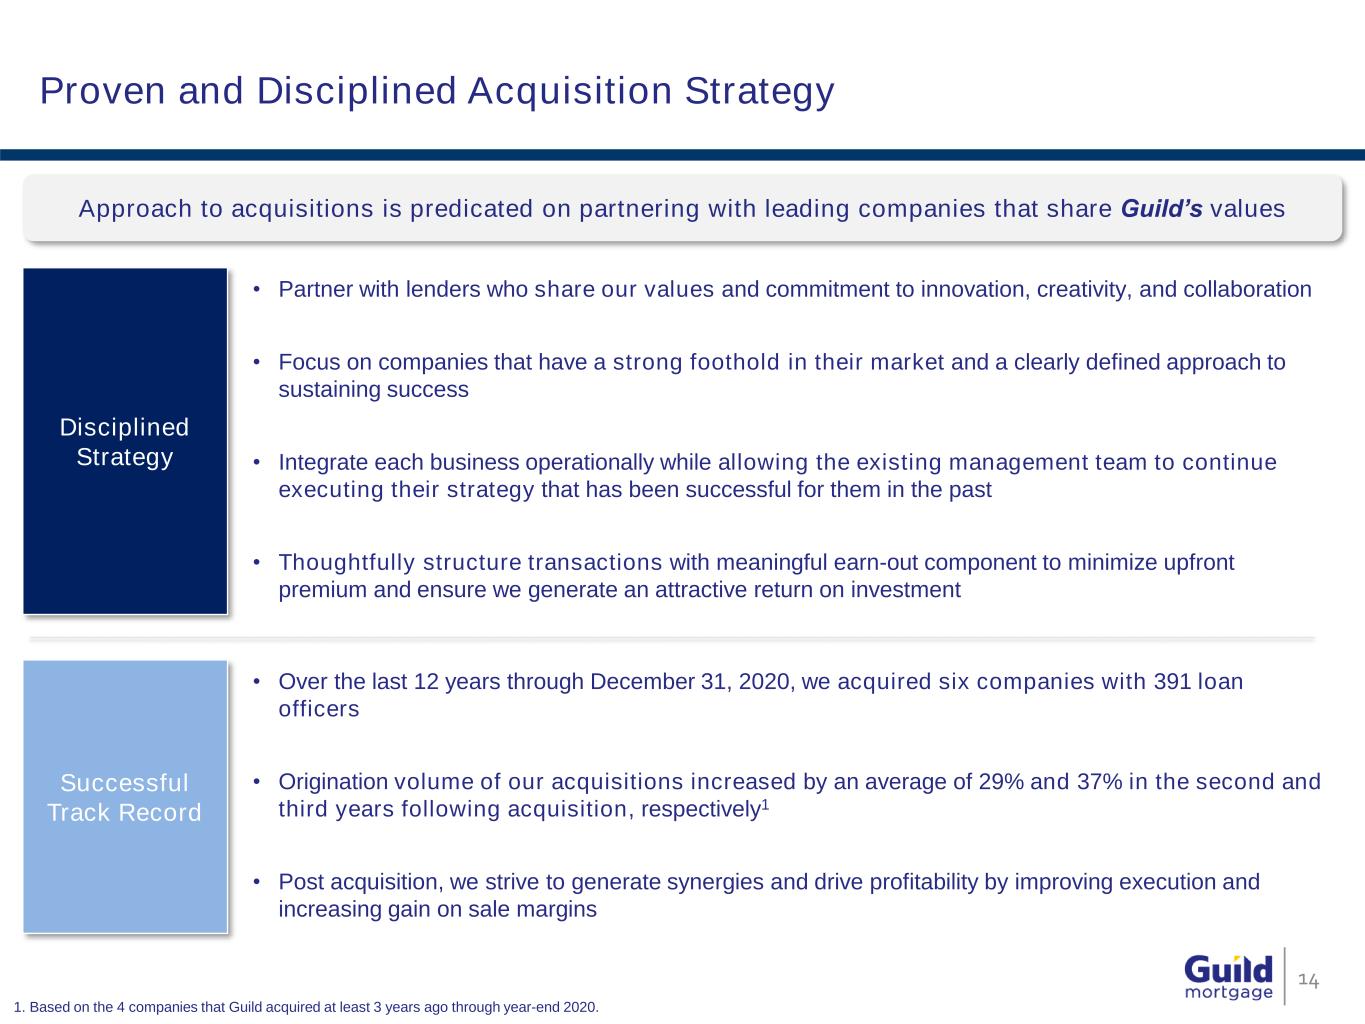
Proven and Disciplined Acquisition Strategy Approach to acquisitions is predicated on partnering with leading companies that share Guild’s values Disciplined Strategy Successful Track Record 14 • Partner with lenders who share our values and commitment to innovation, creativity, and collaboration • Focus on companies that have a strong foothold in their market and a clearly defined approach to sustaining success • Integrate each business operationally while allowing the existing management team to continue executing their strategy that has been successful for them in the past • Thoughtfully structure transactions with meaningful earn-out component to minimize upfront premium and ensure we generate an attractive return on investment • Over the last 12 years through December 31, 2020, we acquired six companies with 391 loan officers • Origination volume of our acquisitions increased by an average of 29% and 37% in the second and third years following acquisition, respectively1 • Post acquisition, we strive to generate synergies and drive profitability by improving execution and increasing gain on sale margins 1. Based on the 4 companies that Guild acquired at least 3 years ago through year-end 2020.
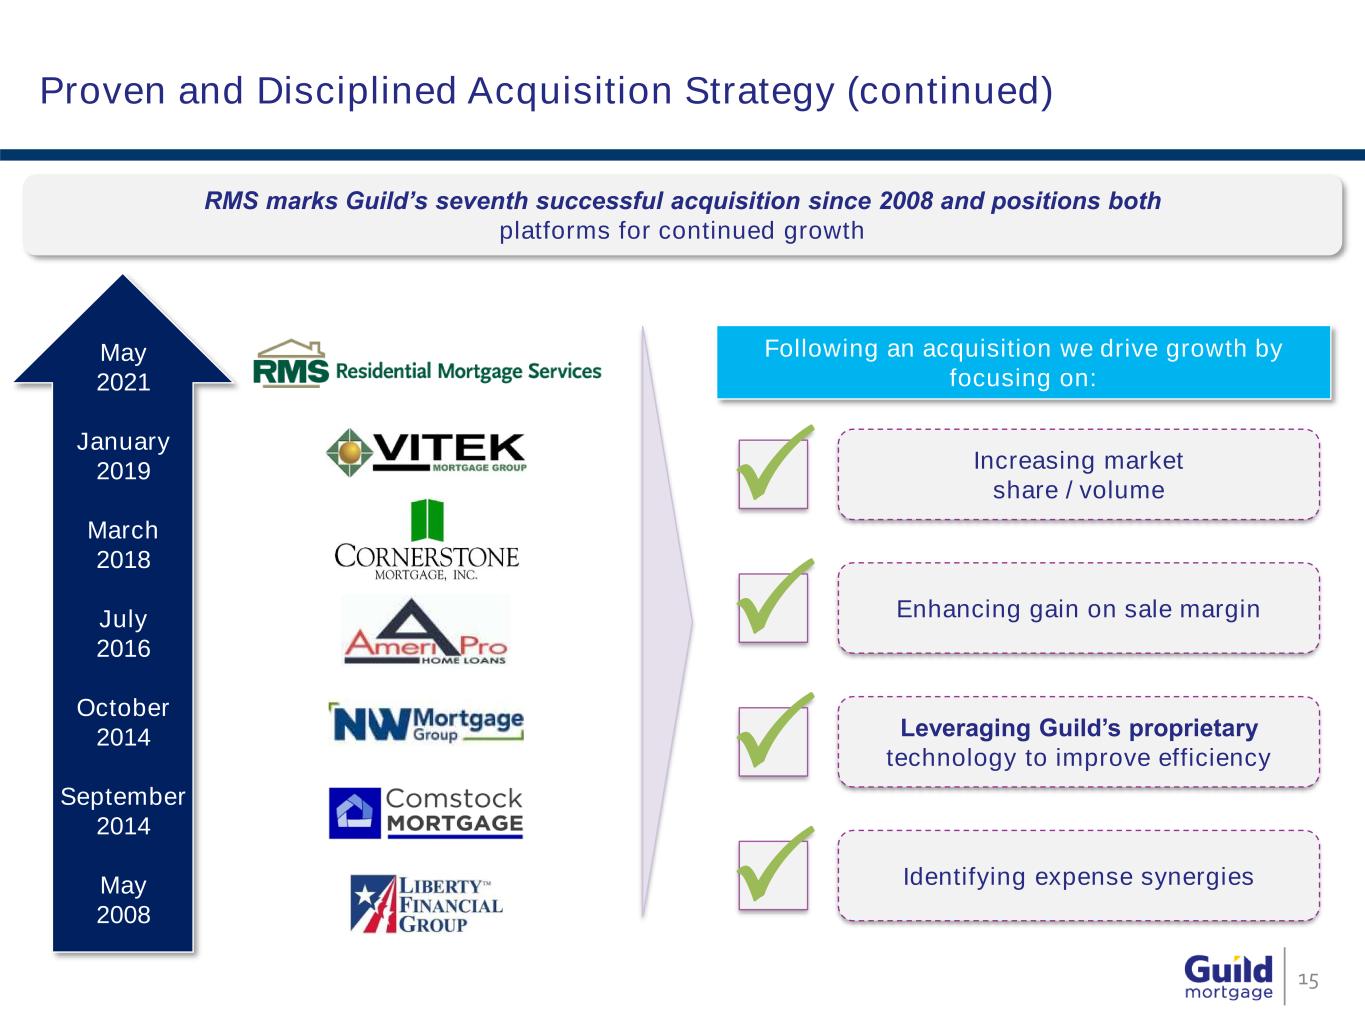
Proven and Disciplined Acquisition Strategy (continued) 15 Following an acquisition we drive growth by focusing on: Increasing market share / volume Enhancing gain on sale margin Leveraging Guild’s proprietary technology to improve efficiency Identifying expense synergies May 2021 January 2019 March 2018 July 2016 October 2014 September 2014 May 2008 RMS marks Guild’s seventh successful acquisition since 2008 and positions both platforms for continued growth
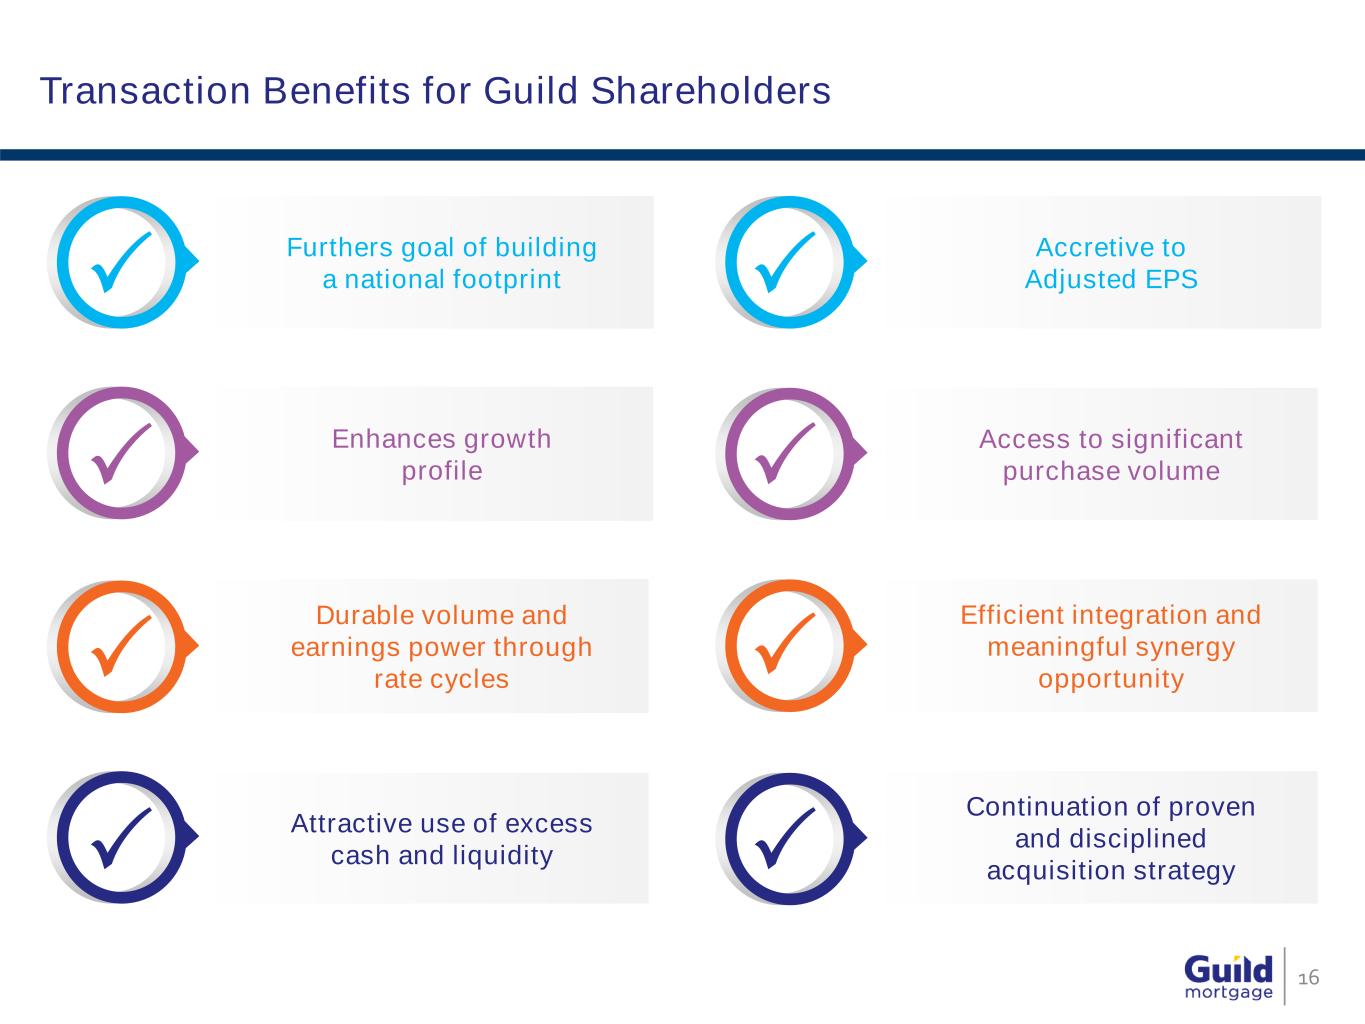
Transaction Benefits for Guild Shareholders 16 Furthers goal of building a national footprint Enhances growth profile Durable volume and earnings power through rate cycles Attractive use of excess cash and liquidity Accretive to Adjusted EPS Access to significant purchase volume Efficient integration and meaningful synergy opportunity Continuation of proven and disciplined acquisition strategy
Appendix – RMS Overview 17
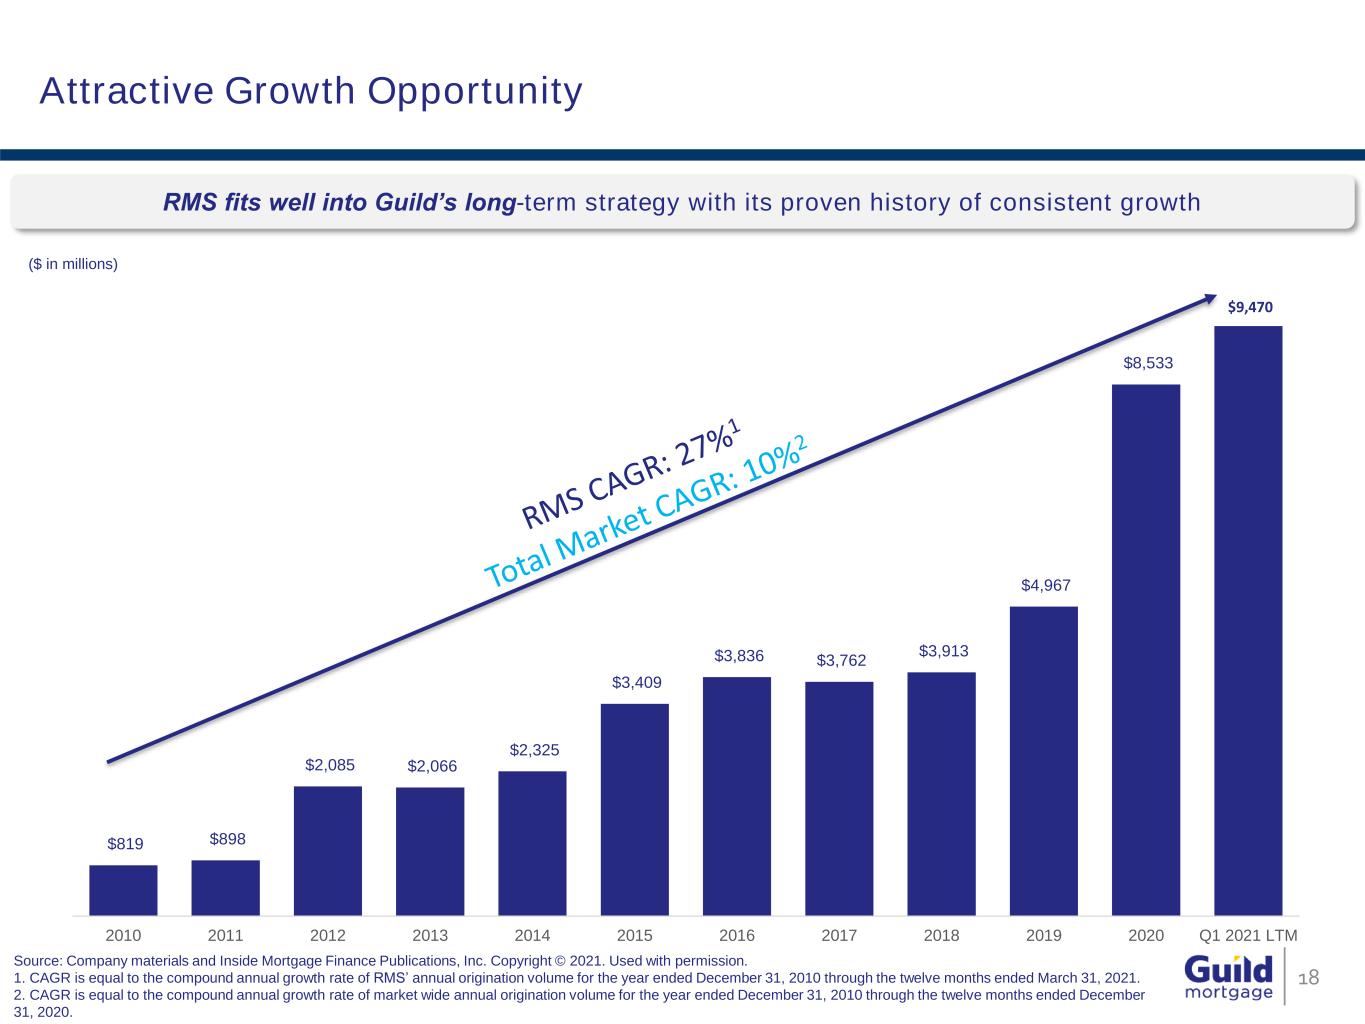
$9,470 $819 $898 $2,085 $2,066 $2,325 $3,409 $3,836 $3,762 $3,913 $4,967 $8,533 2010 2011 2012 2013 2014 2015 2016 2017 2018 2019 2020 Q1 2021 LTM RMS fits well into Guild’s long-term strategy with its proven history of consistent growth Attractive Growth Opportunity 18 ($ in millions) Source: Company materials and Inside Mortgage Finance Publications, Inc. Copyright © 2021. Used with permission. 1. CAGR is equal to the compound annual growth rate of RMS’ annual origination volume for the year ended December 31, 2010 through the twelve months ended March 31, 2021. 2. CAGR is equal to the compound annual growth rate of market wide annual origination volume for the year ended December 31, 2010 through the twelve months ended December 31, 2020.
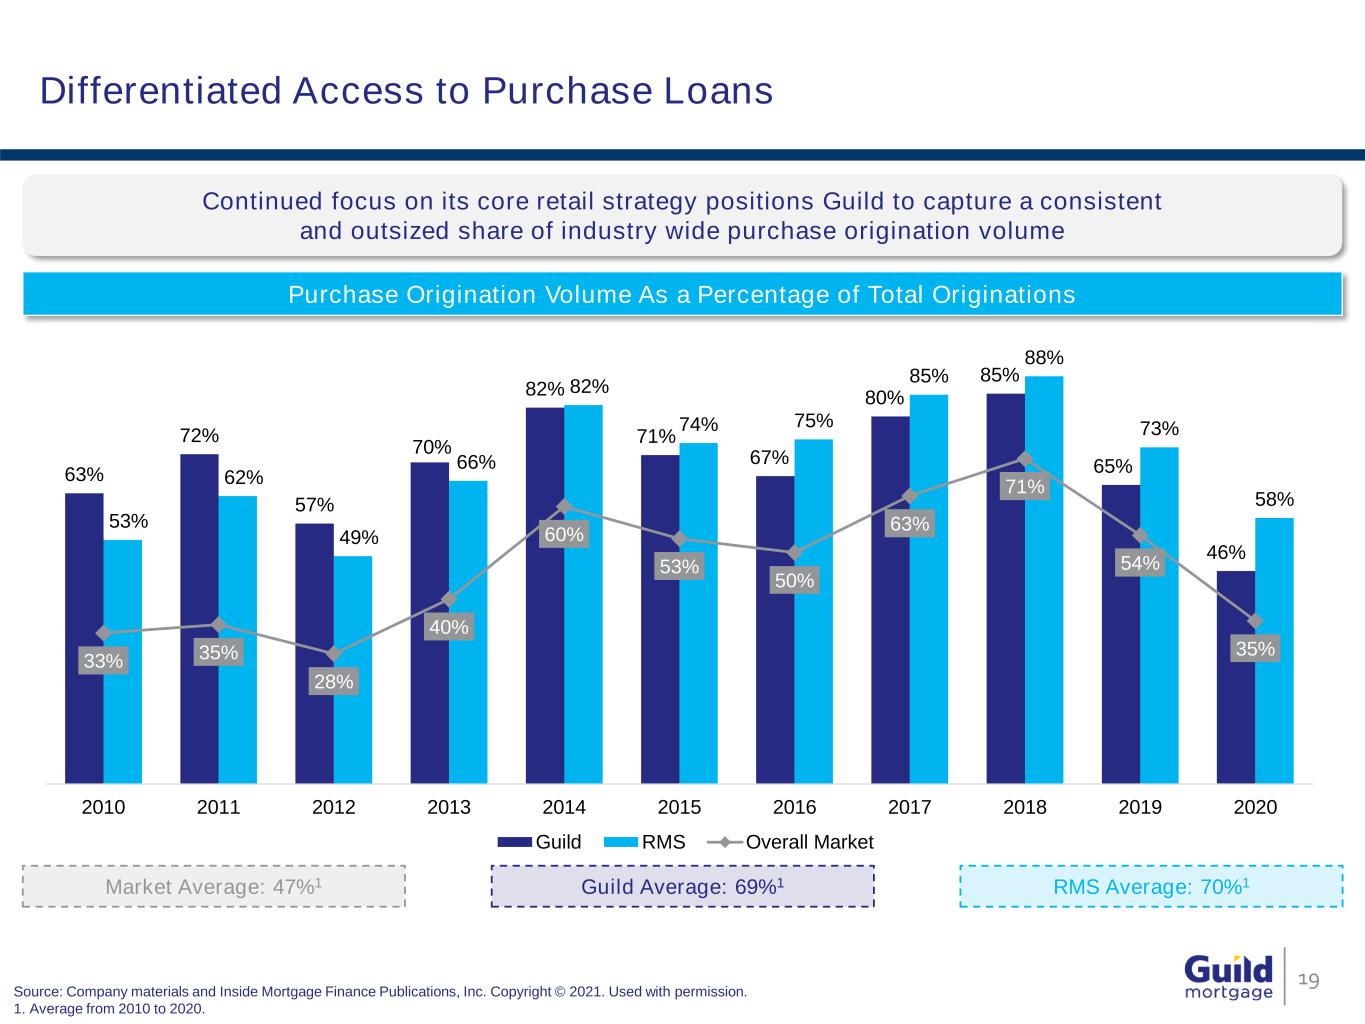
Differentiated Access to Purchase Loans 19 Continued focus on its core retail strategy positions Guild to capture a consistent and outsized share of industry wide purchase origination volume Purchase Origination Volume As a Percentage of Total Originations Market Average: 47%1 Guild Average: 69%1 63% 72% 57% 70% 82% 71% 67% 80% 85% 65% 46% 53% 62% 49% 66% 82% 74% 75% 85% 88% 73% 58% 33% 35% 28% 40% 60% 53% 50% 63% 71% 54% 35% 2010 2011 2012 2013 2014 2015 2016 2017 2018 2019 2020 Guild RMS Overall Market RMS Average: 70%1 Source: Company materials and Inside Mortgage Finance Publications, Inc. Copyright © 2021. Used with permission. 1. Average from 2010 to 2020.
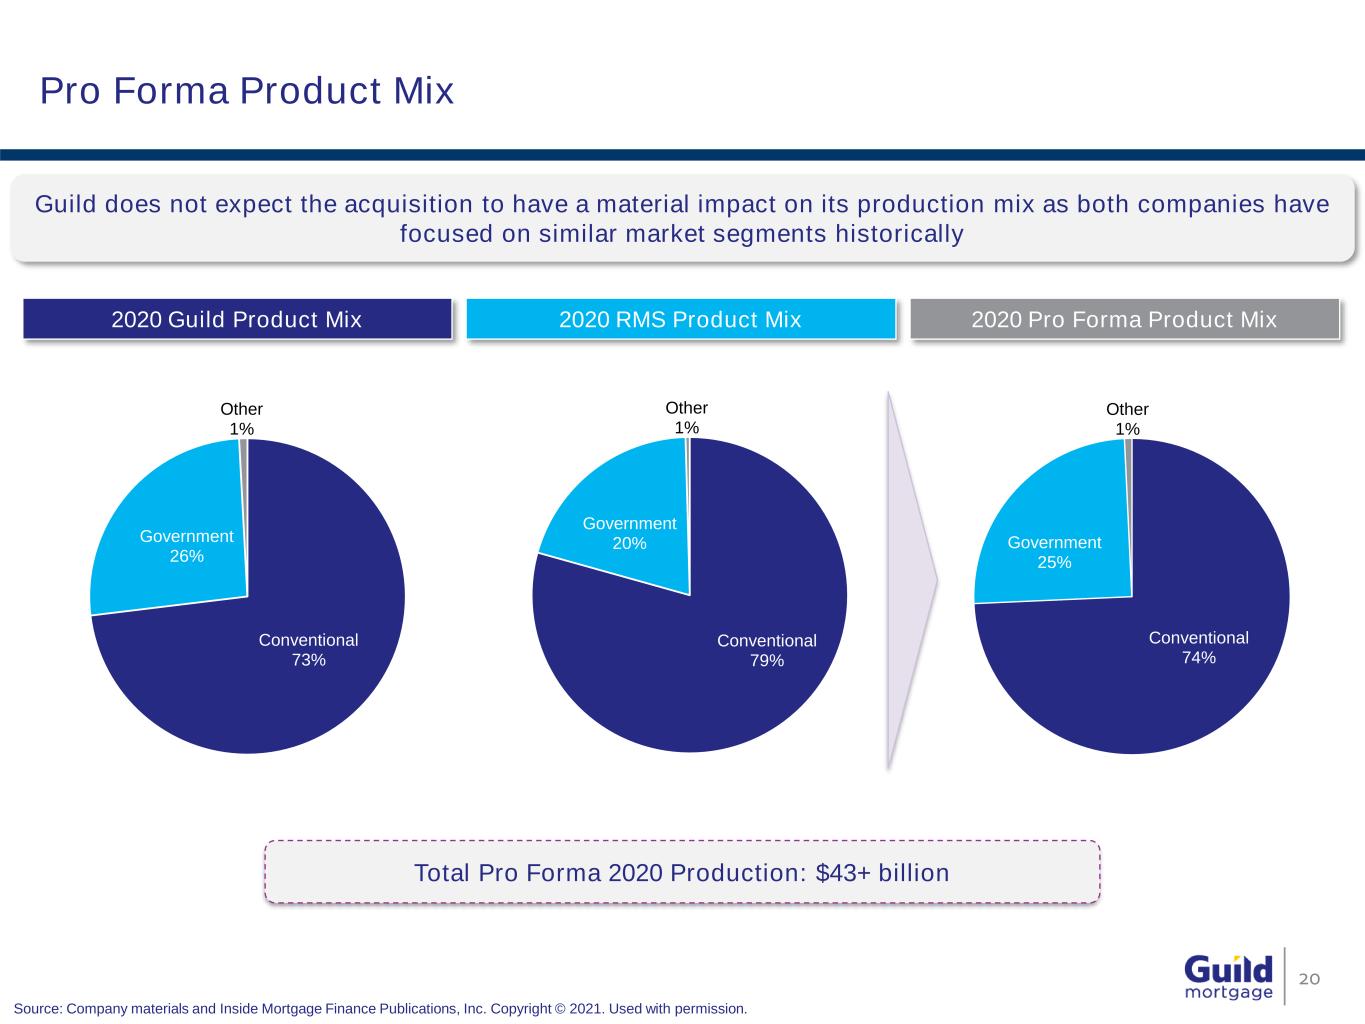
Conventional 73% Government 26% Other 1% Conventional 79% Government 20% Other 1% Conventional 74% Government 25% Other 1% Pro Forma Product Mix 20 2020 Guild Product Mix 2020 RMS Product Mix Total Pro Forma 2020 Production: $43+ billion Guild does not expect the acquisition to have a material impact on its production mix as both companies have focused on similar market segments historically Source: Company materials and Inside Mortgage Finance Publications, Inc. Copyright © 2021. Used with permission. 2020 Pro Forma Product Mix
Appendix – Q1 2021 Financials 21
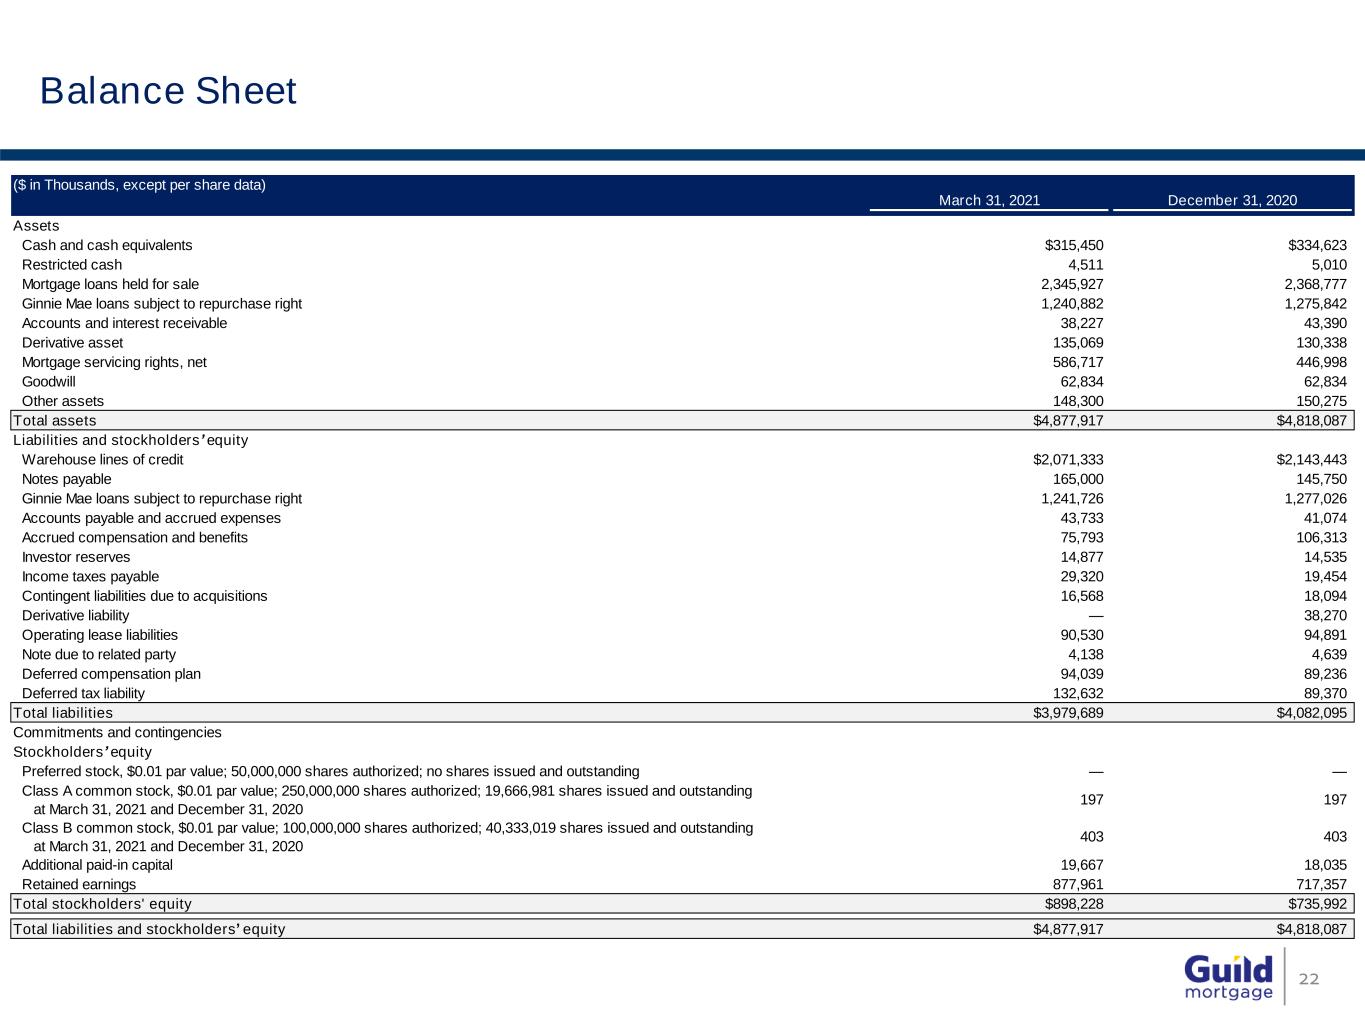
Balance Sheet 22 ($ in Thousands, except per share data) March 31, 2021 December 31, 2020 Assets Cash and cash equivalents $315,450 $334,623 Restricted cash 4,511 5,010 Mortgage loans held for sale 2,345,927 2,368,777 Ginnie Mae loans subject to repurchase right 1,240,882 1,275,842 Accounts and interest receivable 38,227 43,390 Derivative asset 135,069 130,338 Mortgage servicing rights, net 586,717 446,998 Goodwill 62,834 62,834 Other assets 148,300 150,275 Total assets $4,877,917 $4,818,087 Liabilities and stockholders’ equity Warehouse lines of credit $2,071,333 $2,143,443 Notes payable 165,000 145,750 Ginnie Mae loans subject to repurchase right 1,241,726 1,277,026 Accounts payable and accrued expenses 43,733 41,074 Accrued compensation and benefits 75,793 106,313 Investor reserves 14,877 14,535 Income taxes payable 29,320 19,454 Contingent liabilities due to acquisitions 16,568 18,094 Derivative liability — 38,270 Operating lease liabilities 90,530 94,891 Note due to related party 4,138 4,639 Deferred compensation plan 94,039 89,236 Deferred tax liability 132,632 89,370 Total liabilities $3,979,689 $4,082,095 Commitments and contingencies Stockholders’ equity Preferred stock, $0.01 par value; 50,000,000 shares authorized; no shares issued and outstanding — — Class A common stock, $0.01 par value; 250,000,000 shares authorized; 19,666,981 shares issued and outstanding at March 31, 2021 and December 31, 2020 197 197 Class B common stock, $0.01 par value; 100,000,000 shares authorized; 40,333,019 shares issued and outstanding at March 31, 2021 and December 31, 2020 403 403 Additional paid-in capital 19,667 18,035 Retained earnings 877,961 717,357 Total stockholders' equity $898,228 $735,992 Total liabilities and stockholders’ equity $4,877,917 $4,818,087
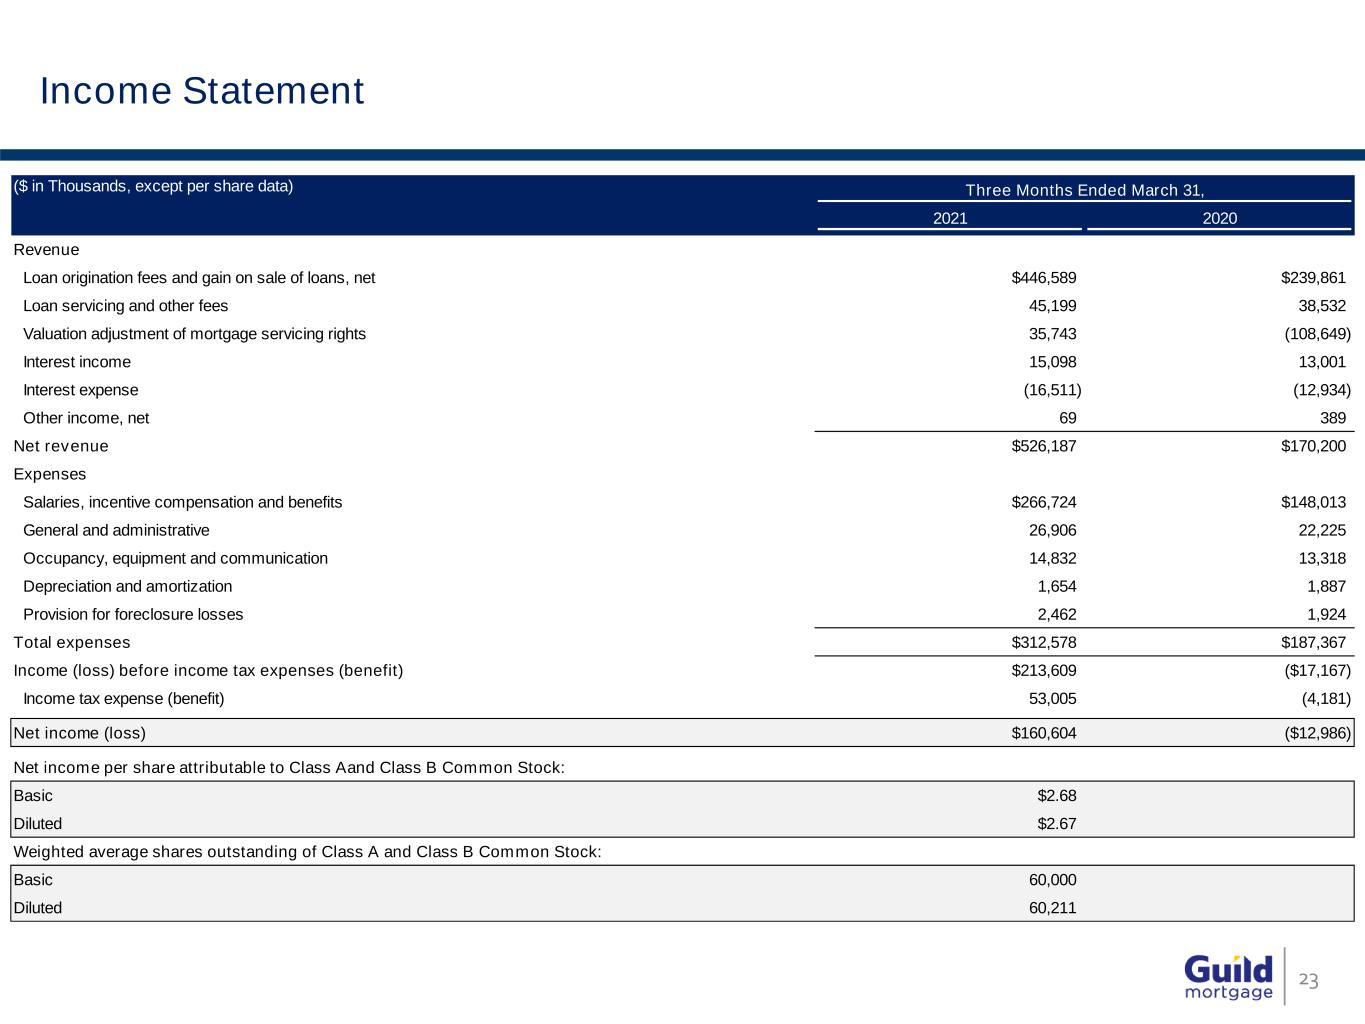
Income Statement 23 ($ in Thousands, except per share data) Three Months Ended March 31, 2021 2020 Revenue Loan origination fees and gain on sale of loans, net $446,589 $239,861 Loan servicing and other fees 45,199 38,532 Valuation adjustment of mortgage servicing rights 35,743 (108,649) Interest income 15,098 13,001 Interest expense (16,511) (12,934) Other income, net 69 389 Net revenue $526,187 $170,200 Expenses Salaries, incentive compensation and benefits $266,724 $148,013 General and administrative 26,906 22,225 Occupancy, equipment and communication 14,832 13,318 Depreciation and amortization 1,654 1,887 Provision for foreclosure losses 2,462 1,924 Total expenses $312,578 $187,367 Income (loss) before income tax expenses (benefit) $213,609 ($17,167) Income tax expense (benefit) 53,005 (4,181) Net income (loss) $160,604 ($12,986) Net income per share attributable to Class Aand Class B Common Stock: Basic $2.68 Diluted $2.67 Weighted average shares outstanding of Class A and Class B Common Stock: Basic 60,000 Diluted 60,211
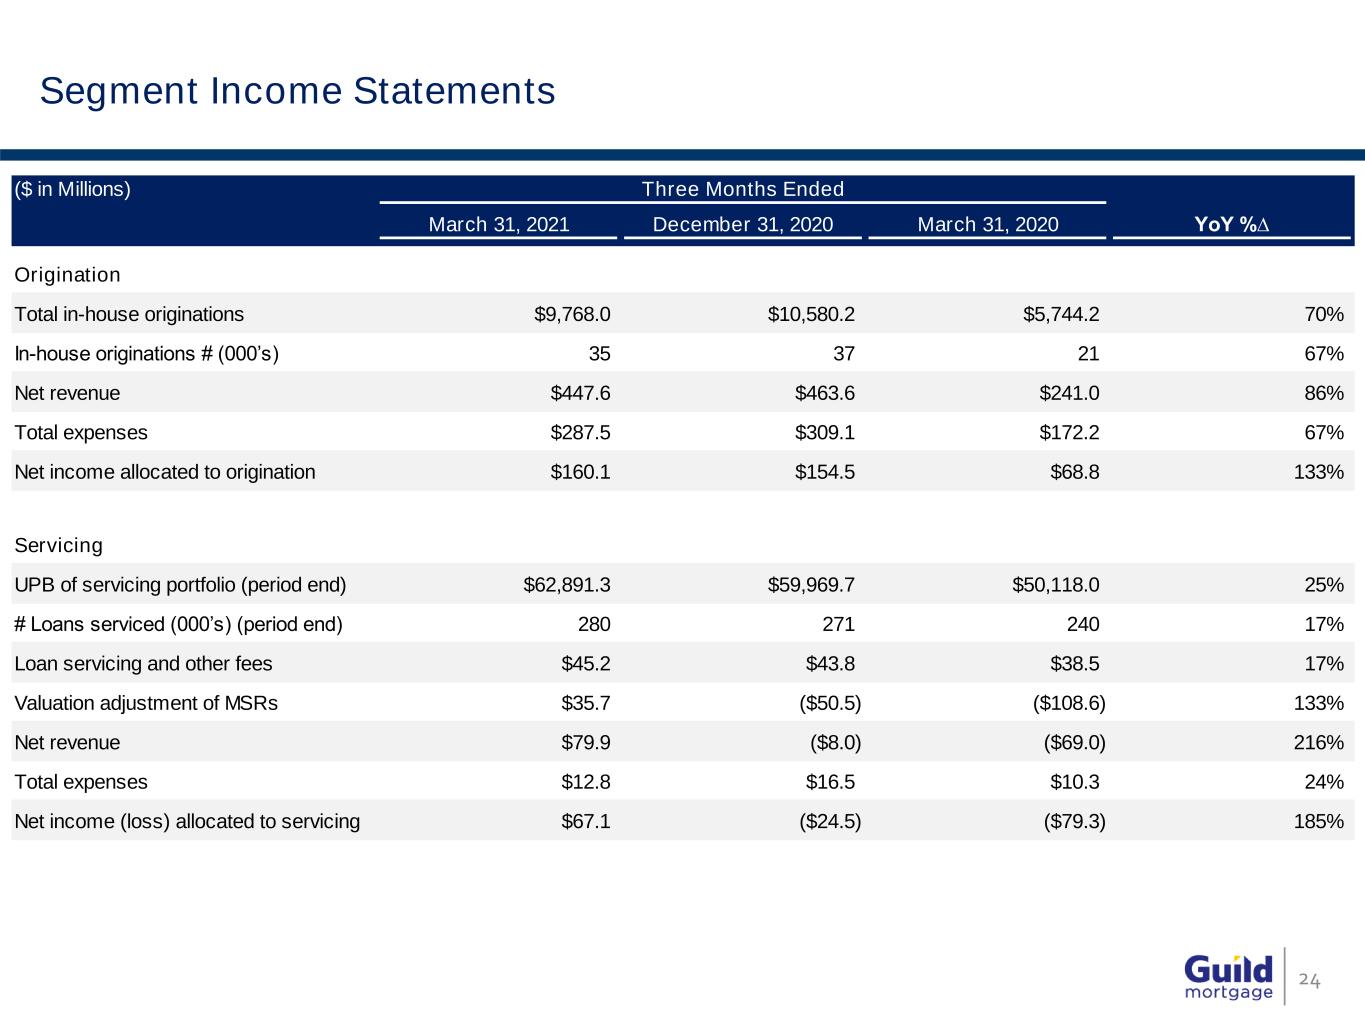
Segment Income Statements 24 ($ in Millions) Three Months Ended March 31, 2021 December 31, 2020 March 31, 2020 YoY %∆ Origination Total in-house originations $9,768.0 $10,580.2 $5,744.2 70% In-house originations # (000’s) 35 37 21 67% Net revenue $447.6 $463.6 $241.0 86% Total expenses $287.5 $309.1 $172.2 67% Net income allocated to origination $160.1 $154.5 $68.8 133% Servicing UPB of servicing portfolio (period end) $62,891.3 $59,969.7 $50,118.0 25% # Loans serviced (000’s) (period end) 280 271 240 17% Loan servicing and other fees $45.2 $43.8 $38.5 17% Valuation adjustment of MSRs $35.7 ($50.5) ($108.6) 133% Net revenue $79.9 ($8.0) ($69.0) 216% Total expenses $12.8 $16.5 $10.3 24% Net income (loss) allocated to servicing $67.1 ($24.5) ($79.3) 185%
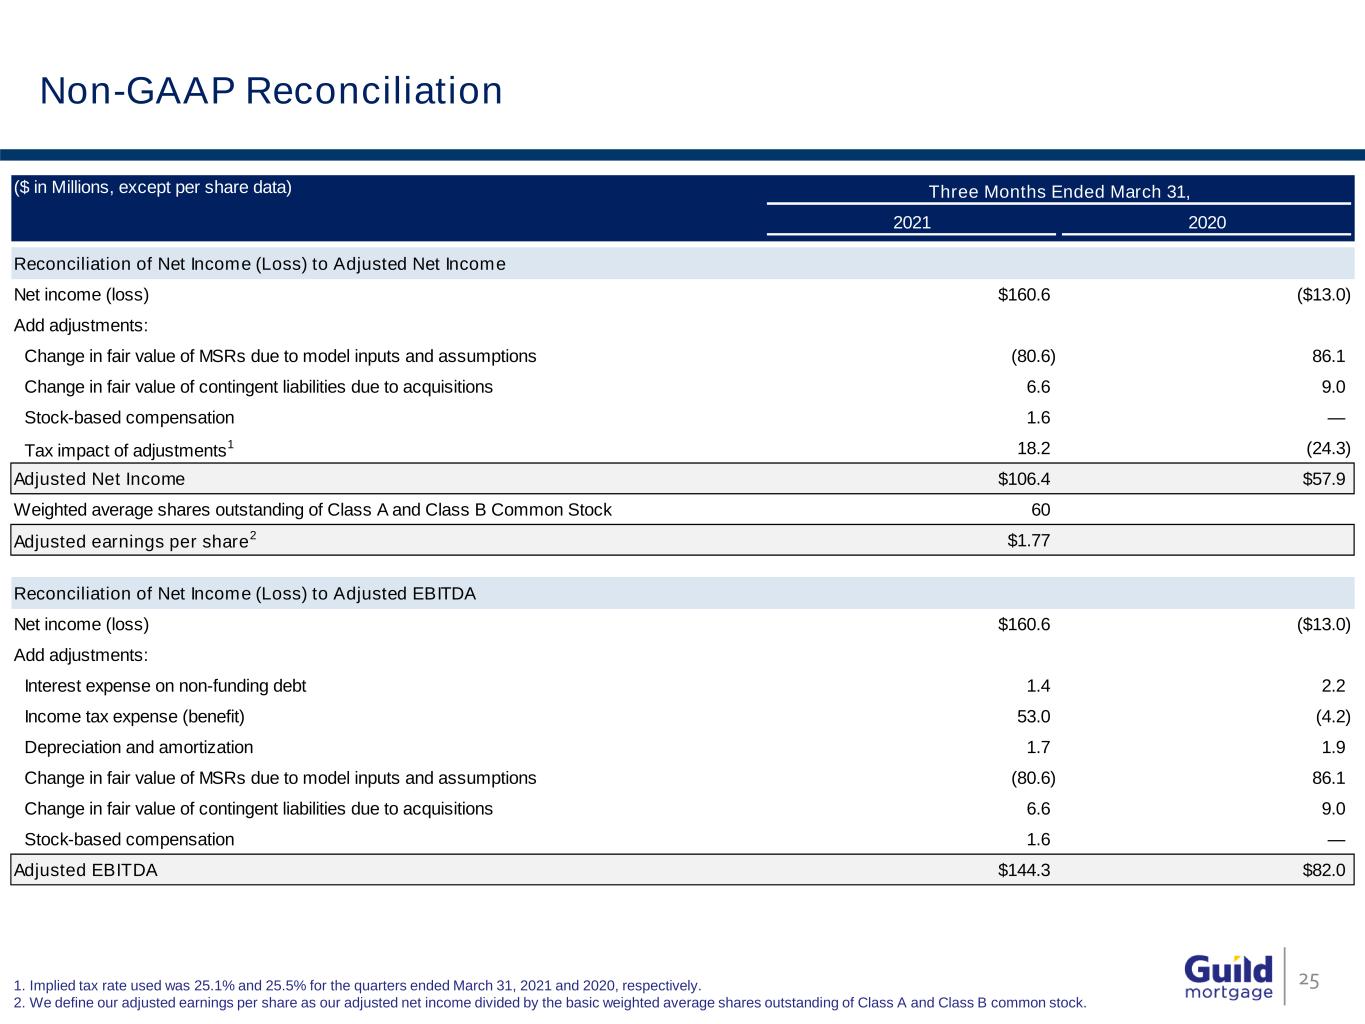
Non-GAAP Reconciliation 251. Implied tax rate used was 25.1% and 25.5% for the quarters ended March 31, 2021 and 2020, respectively. 2. We define our adjusted earnings per share as our adjusted net income divided by the basic weighted average shares outstanding of Class A and Class B common stock. ($ in Millions, except per share data) Three Months Ended March 31, 2021 2020 Reconciliation of Net Income (Loss) to Adjusted Net Income Net income (loss) $160.6 ($13.0) Add adjustments: Change in fair value of MSRs due to model inputs and assumptions (80.6) 86.1 Change in fair value of contingent liabilities due to acquisitions 6.6 9.0 Stock-based compensation 1.6 — Tax impact of adjustments 1 18.2 (24.3) Adjusted Net Income $106.4 $57.9 Weighted average shares outstanding of Class A and Class B Common Stock 60 Adjusted earnings per share 2 $1.77 Reconciliation of Net Income (Loss) to Adjusted EBITDA Net income (loss) $160.6 ($13.0) Add adjustments: Interest expense on non-funding debt 1.4 2.2 Income tax expense (benefit) 53.0 (4.2) Depreciation and amortization 1.7 1.9 Change in fair value of MSRs due to model inputs and assumptions (80.6) 86.1 Change in fair value of contingent liabilities due to acquisitions 6.6 9.0 Stock-based compensation 1.6 — Adjusted EBITDA $144.3 $82.0

26