UNITED STATES
SECURITIES AND EXCHANGE COMMISSION
WASHINGTON, DC 20549
FORM
|
|
ANNUAL REPORT PURSUANT TO SECTION 13 OR 15(d) OF THE SECURITIES EXCHANGE ACT OF 1934 |
For the fiscal year ended
OR
|
|
TRANSITION REPORT UNDER SECTION 13 OR 15(d) OF THE SECURITIES EXCHANGE ACT OF 1934 |
For the transition period from _____________ to _____________
Commission file number:
(Exact Name of Registrant as Specified in its Charter)
|
|
|
|
(State or other jurisdiction of incorporation or organization) |
(I.R.S. Employer |
|
|
|
|
(Address of principal executive offices) |
(Zip Code) |
Registrant’s telephone number, including area code: (
Securities registered pursuant to Section 12(b) of the Act:
|
Title of each class |
|
Trading Symbol(s) |
|
Name of each exchange on which registered |
|
|
|
|
|
|
Securities registered pursuant to Section 12(g) of the Act: None.
Indicate by check mark if the registrant is a well-known seasoned issuer, as defined in Rule 405 of the Securities Act. Yes ☐
Indicate by check mark if the registrant is not required to file reports pursuant to Section 13 or Section 15(d) of the Act. Yes ☐
Note – Checking the box above will not relieve any registrant required to file reports pursuant to Section 13 or 15(d) of the Exchange Act from their obligations under those Sections.
Indicate by check mark whether the registrant (1) has filed all reports required by Section 13 or 15(d) of the Securities Exchange Act of 1934 during the preceding 12 months (or for such shorter period that the registrant was required to file such reports), and (2) has been subject to such filing requirements for the past 90 days.
Indicate by check mark whether the registrant has submitted electronically every Interactive Data File required to be submitted pursuant to Rule 405 of Regulation S-T (§ 232.405 of this chapter) during the preceding 12 months (or for such shorter period that the registrant was required to submit such files).
Indicate by check mark whether the registrant is a large accelerated filer, an accelerated filer, a non-accelerated filer, a smaller reporting company, or an emerging growth company. See the definitions of “large accelerated filer,” “accelerated filer,” “smaller reporting company,” and “emerging growth company” in Rule 12b-2 of the Exchange Act.
|
Large accelerated filer |
☐ |
Accelerated filer |
☐ |
|
|
☒ |
Smaller reporting company |
|
|
|
|
Emerging Growth Company |
|
If an emerging growth company, indicate by check mark if the registrant has elected not to use the extended transition period for complying with any new or revised financial accounting standards provided pursuant to Section 13(a) of the Exchange Act. ☐
Indicate by check mark whether the registrant has filed a report on and attestation to its management’s assessment of the effectiveness of its internal control over financial reporting under Section 404(b) of the Sarbanes-Oxley Act (15 U.S.C. 7262(b)) by the registered public accounting firm that prepared or issued its audit report.
Indicate by check mark whether the registrant is a shell company (as defined in Rule 12b-2 of the Act). Yes
As of June 30, 2020, the last business day of the registrant’s most recently completed second fiscal quarter, the registrant was not a public company, and therefore, cannot calculate the aggregate market value of its voting and non-voting common equity held by non-affiliates as of such date. The registrant’s Class A common stock began trading on the New York Stock Exchange on October 22, 2020.
As of March 18, 2021, the registrant had
DOCUMENTS INCORPORATED BY REFERENCE
Portions of the registrant’s definitive proxy statement to be filed with the Securities and Exchange Commission pursuant to Regulation 14A under the Securities Exchange Act of 1934, as amended, relating to the registrant’s Annual Meeting of Stockholders to be held on May 6, 2021, are incorporated herein by reference for purposes of Items 10, 11, 12, 13 and 14 of Part III of this Annual Report on Form 10-K. The definitive proxy statement will be filed with the Securities and Exchange Commission not later than 120 days after the registrant’s fiscal year ended December 31, 2020.
GUILD HOLDINGS COMPANY
Annual Report on Form 10-K for the Year Ended December 31, 2020
Table of Contents
|
|
Page |
|
|
CAUTIONARY STATEMENT REGARDING FORWARD LOOKING STATEMENTS |
|
|
|
|
|
|
|
3 |
||
|
|
4 |
|
|
|
10 |
|
|
|
21 |
|
|
|
21 |
|
|
|
21 |
|
|
|
21 |
|
|
22 |
||
|
|
22 |
|
|
|
22 |
|
|
|
ITEM 7. MANAGEMENT’S DISCUSSION AND ANALYSIS OF FINANCIAL CONDITION AND RESULTS OF OPERATIONS |
23 |
|
|
ITEM 7A. QUANTITATIVE AND QUALITATIVE DISCLOSURES ABOUT MARKET RISK |
41 |
|
|
42 |
|
|
|
ITEM 9. CHANGES IN AND DISAGREEMENTS WITH ACCOUNTANTS ON ACCOUNTING AND FINANCIAL DISCLOSURE |
72 |
|
|
72 |
|
|
|
72 |
|
|
73 |
||
|
|
ITEM 10. DIRECTORS, EXECUTIVE OFFICERS AND CORPORATE GOVERNANCE |
73 |
|
|
73 |
|
|
|
73 |
|
|
|
ITEM 13. CERTAIN RELATIONSHIPS AND RELATED TRANSACTIONS, AND DIRECTOR INDEPENDENCE |
73 |
|
|
73 |
|
|
74 |
||
|
|
74 |
|
|
|
78 |
|
2
PART I
Guild Mortgage Company, a California corporation, incorporated in 1960, was our operating company prior to our initial public offering (the “IPO”) and became a wholly-owned subsidiary of Guild Holdings Company, a Delaware corporation, incorporated in 2020, in connection with a series of reorganization transactions consummated in connection with the IPO. Prior to the consummation of the reorganization transactions and in reference to events which took place prior to the consummation of the reorganization transactions, unless the context requires otherwise, the words “Guild,” “we,” the “Company,” “us,” and “our” refer to Guild Mortgage Company and its consolidated subsidiaries. Subsequent to the consummation of the reorganization transactions and in reference to events which have taken place subsequent to the consummation of the reorganization transactions, unless the context requires otherwise, the words “Guild,” “we,” the “Company,” “us,” and “our” refer to Guild Holdings Company and its consolidated subsidiaries.
CAUTIONARY STATEMENT REGARDING FORWARD LOOKING STATEMENTS
This Annual Report on Form 10-K (this “Annual Report”) contains forward-looking statements. These forward-looking statements reflect our current views with respect to, among other things, future events and our financial performance. These statements are often, but not always, made through the use of words or phrases such as “may,” “should,” “could,” “predict,” “potential,” “believe,” “will likely result,” “expect,” “continue,” “will,” “anticipate,” “seek,” “estimate,” “intend,” “plan,” “projection,” “would” and “outlook,” or the negative version of those words or other comparable words or phrases of a future or forward-looking nature. These forward-looking statements are not historical facts and are based on current expectations, estimates and projections about our industry, management’s beliefs and certain assumptions made by management, many of which, by their nature, are inherently uncertain and beyond our control. Accordingly, we caution you that any such forward-looking statements are not guarantees of future performance and are subject to risks, assumptions and uncertainties that are difficult to predict. Although we believe that the expectations reflected in these forward-looking statements are reasonable as of the date made, actual results may prove to be materially different from the results expressed or implied by the forward-looking statements.
Important factors that could cause our actual results to differ materially from those indicated in these forward-looking statements include, but are not limited to, the following:
|
|
• |
any changes in macro-economic conditions and in U.S. residential real estate market conditions, including changes in prevailing interest rates or monetary policies and the effects of the ongoing COVID-19 pandemic; |
|
|
• |
any disruptions in the secondary home loan market and their effects on our ability to sell the loans that we originate; |
|
|
• |
any changes in certain U.S. government-sponsored entities and government agencies, including Federal National Mortgage Association (“FNMA”), the Federal Home Loan Mortgage Corporation (“FHLMC”), Government National Mortgage Association (“GNMA”), the Federal Housing Administration (“FHA”), the United States Department of Agriculture Rural Development (“USDA”) and the United States Department of Veteran’s Affairs (“VA”), or their current roles; |
|
|
• |
the effects of any termination of our servicing rights; |
|
|
• |
the effects of our existing and future indebtedness on our liquidity and our ability to operate our business; |
|
|
• |
any failure to maintain and improve the technological infrastructure that supports our origination and servicing platform; |
|
|
• |
any failure to maintain or grow our historical referral relationships with our referral partners; |
|
|
• |
any failure to continue the historical levels of growth in our market share in the mortgage origination and servicing industry; |
|
|
• |
any decline in our ability to recapture loans from borrowers who refinance; |
|
|
• |
our inability to attract, integrate and retain qualified personnel; our failure to identify, develop and integrate acquisitions of other companies or technologies, or any diversion of our management’s attention due to the foregoing; |
|
|
• |
inaccuracies in the estimates of the fair value of the substantial portion of our assets that are measured on that basis (including our mortgage servicing rights, or “MSRs”); |
|
|
• |
the failure of the internal models that we use to manage risk and make business decisions to produce reliable or accurate results; |
|
|
• |
the costs of potential litigation and claims; the degree of business and financial risk associated with certain of our loans; |
|
|
• |
any cybersecurity breaches or other attacks involving our computer systems or those of our third-party service providers; |
|
|
• |
any changes in applicable technology and consumer outreach techniques; |
|
|
• |
our inability to secure additional capital, if needed, to operate and grow our business; |
|
|
• |
the impact of operational risks, including employee or consumer fraud, the obligation to repurchase sold loans in the event of a documentation error, and data processing system failures and errors; |
3
|
|
• |
any repurchase or indemnification obligations caused by the failure of the loans that we originate to meet certain criteria or characteristics; |
|
|
• |
the seasonality of the mortgage origination industry; |
|
|
• |
any failure to protect our brand and reputation; |
|
|
• |
the risks associated with adverse weather conditions and man-made or natural events; our exposure to additional income tax liabilities and changes in tax laws, or disagreements with the Internal Revenue Service (“IRS”) regarding our tax positions; |
|
|
• |
any failure to adequately protect our intellectual property and the costs of any potential intellectual property disputes; |
|
|
• |
any non-compliance with the complex laws and regulations governing our industry and the related costs associated with maintaining and monitoring compliance; |
|
|
• |
any changes in the laws and regulations governing our industry that would require us to change our business practices, raise compliance costs or other costs of doing business; |
|
|
• |
our control by, and any conflicts of interest with, McCarthy Capital Mortgage Investors, LLC (“MCMI”); |
|
|
• |
the significant influence on our business that members of our board and management team are able to exercise as stockholders; |
|
|
• |
our dependence, as a holding company, upon distributions from Guild Mortgage Company to meet our obligations; |
|
|
• |
the risks related to our becoming a public company; |
|
|
• |
the risks related to our status as a “controlled company”; and |
|
|
• |
the risks related to our Class A common stock and our dual class common stock structure. |
You should not rely upon forward-looking statements as predictions of future events. We have based the forward-looking statements contained in this Annual Report primarily on our current expectations and projections about future events and trends that we believe may affect our business, financial condition, results of operations and prospects. The outcome of the events described in these forward-looking statements is subject to risks, uncertainties and other factors described in the section titled “Risk Factors” and elsewhere in this Annual Report. Moreover, we operate in a very competitive environment. New risks and uncertainties emerge from time to time and it is not possible for us to predict all risks and uncertainties that could have an impact on the forward-looking statements contained in this Annual Report. We cannot assure you that the results, events and circumstances reflected in the forward-looking statements will be achieved or occur, and actual results, events or circumstances could differ materially from those described in the forward-looking statements.
The forward-looking statements made in this Annual Report relate only to events as of the date on which the statements are made. We undertake no obligation to update any forward-looking statements made in this Annual Report to reflect events or circumstances after the date of this Annual Report or to reflect new information or the occurrence of unanticipated events, except as required by law. We may not actually achieve the plans, intentions or expectations disclosed in our forward-looking statements and you should not place undue reliance on our forward-looking statements. Our forward-looking statements do not reflect the potential impact of any future acquisitions, mergers, dispositions, joint ventures, or investments we may make.
ITEM 1. BUSINESS
Guild Holdings Company, including our consolidated subsidiaries (collectively, “Guild”, the “Company”, “we”, “us” or “our”) is a growth-oriented mortgage company that employs a relationship-based loan sourcing strategy to execute on our mission of delivering the promise of home ownership in neighborhoods and communities across the United States. Our business model is centered on providing a personalized mortgage-borrowing experience that is delivered by our knowledgeable loan officers and supported by our diverse product offerings.
Guild was initially incorporated in California in 1960 as Guild Mortgage Company, and we are among the longest-operating seller-servicers in the United States. Over the course of our operating history, we have navigated numerous economic cycles and market dislocations. We have also expanded our retail origination operation to 32 states within the United States, and we have developed end-to-end technology systems, a reputable brand, industry expertise and many durable relationships with our clients and members of our referral network.
In 2007, seeing an opportunity to expand our sales and production strategy and grow our market share, a management-led partnership that included a majority investment from Fulcrum Mortgage, LLC, now known as McCarthy Capital Mortgage Investors, LLC, acquired the Company from its founder and created a California limited liability company, Guild Investors, LLC, as the parent entity. Following the acquisition, we embarked on a growth strategy focused on prudently expanding our geographic footprint beyond the West Coast. We expect to continue to expand our business in the geographic areas in which we already serve our clients, as well as in new markets throughout the United States.
Immediately prior to our initial public offering in 2020, we engaged in an internal reorganization that simplified our organizational structure, incorporating Guild Holdings Company in Delaware, making Guild Mortgage Company its wholly owned subsidiary and converted Guild Mortgage Company to a California limited liability company.
4
Our business model benefits from the complementary relationship between our origination and servicing segments which, together, have propelled our performance through interest rate and market cycles.
Our Business Model
Our origination strategy focuses on increasing our purchase-mortgage business and providing a superior personalized mortgage-borrowing experience that encourages our clients to return to us. This is successfully executed through a combination of our experienced loan officers, our technology platform, and diverse product offerings. Our business model provides clients with both a comprehensive digital interface and an experienced team that delivers high-tech, high-touch client service, allowing clients to engage with us in whatever format and frequency provides them the most comfort and convenience. This strategy allows us to generate consistent origination volume through differing market environments, contributes to our servicing segment and facilitates business from repeat clients.
Our in-house servicing platform creates opportunities to extend our relationship with clients and generates refinance and purchase volume that replenishes run-off from our servicing portfolio. In coordination with our portfolio recapture team, our loan officers handle recapture activity for their existing client base directly, rather than outsourcing that function through a call center. This approach creates a continuous client relationship that we believe encourages repeat business. In addition, our scalable servicing platform provides a recurring stream of revenue that is complementary to our origination business.
Business Segments
Origination
Retail Channel
Our retail channel, which makes up approximately 97% of our origination segment, focuses on serving our clients and referral partners in the markets we serve. We generate revenue through gain-on-sale and fees associated with originating and selling mortgage loans to the secondary market. We utilize warehouse facilities to fund originated loans and the mortgage loans are typically sold within 30 days of origination. After we sell originated mortgage loans to the secondary market, we generally retain the servicing rights on mortgage loans sold.
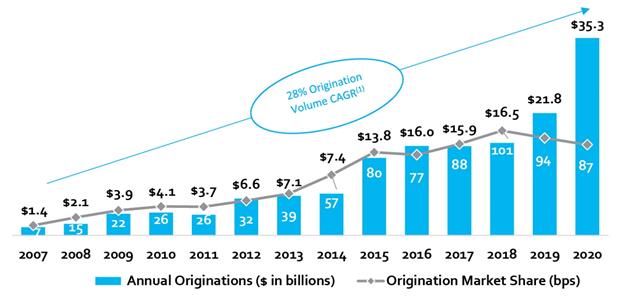
For the years ended December 31, 2020 and 2019 we originated $34.3 billion and $20.9 billion, respectively, in retail mortgage loan originations.
Our loan products are underwritten using a disciplined approach that focuses on credit risk and responsible lending. Our proprietary technology platform is regularly updated to incorporate new investor guidelines as well as state and federal regulations. These controls are designed to ensure integrity over data and qualification requirements, facilitate the manufacturing of quality loan originations and minimize underwriting defects. The loan products we offer include loans eligible for sale or securitization to secondary market participants such as the GSEs, Ginnie Mae, state housing agencies and other private or institutional investors. The underwriting guidelines for these products are established by the entities that will purchase, insure or guaranty the loans (i.e., Fannie Mae, Freddie Mac, the United States Department of Housing and Urban Development (“HUD”), the United States Department of Veterans Affairs (“VA”), the United States Department of Agriculture (“USDA”), private mortgage insurers and institutional and private investors). The majority of our loan products are sold to either Fannie Mae, Freddie Mac or Ginnie Mae.
Our success in the retail market is tied to the expertise of our loan officers and the strength of our referral partner network. We have built our referral network by providing our clients with a personalized mortgage-borrowing experience that is delivered by a knowledgeable loan officer. Our referral network relationships, including realtors, builders, existing clients, and financial planners, have been cultivated over years and are bolstered by our strong presence in the communities we serve. These referral partner network relationships enhance our ability to generate repeat business and recapture volume.
Correspondent Channel
In addition to the retail channel of our origination segment, we maintain an active correspondent channel that purchases closed loans primarily from small community banks and credit unions. We are able to offer a diverse product set through the correspondent channel, and similar to the retail channel, rely on our differentiated client service to generate origination volume.
We also utilize our correspondent channel to support our growth efforts. As we work to expand into new locations, the correspondent channel serves as an entry point to begin building our brand, reputation and client base.
Servicing
We have purposefully developed our in-house servicing platform and have invested significant resources expanding and upgrading its technology and infrastructure over time. The unique combination of in-house servicing and proprietary technology allows for enhanced servicing practices and embedded compliance controls throughout the system.
As of December 31, 2020, we served approximately 271,000 customers with an aggregate unpaid principal balance (“UPB”) of approximately $60.0 billion. Our loan servicing segment performs loan administration, collection, and default management activities, including the collection and remittance of loan payments; response to customer inquiries; accounting for principal and interest; holding custodial (impounded) funds for the payment of property taxes and insurance premiums; counseling delinquent borrowers; and supervising foreclosures and property dispositions.
5
Our servicing segment is based out of our servicing center in San Diego, California, and we are a licensed mortgage servicer in 48 states and the District of Columbia. Our primary source of revenue for our servicing operations is based upon a stated fee per loan that varies by investor. This fee is earned on a monthly basis as the borrower makes each payment.
As the owner of the mortgage servicing right (“MSR”), depending on the investors’ requirements and the loan program, we may be obligated to make servicing advances to fund scheduled principal, interest, tax and insurance payments when the mortgage loan borrower has failed to make the scheduled payments and to cover foreclosure costs and various other items required to preserve the assets being serviced.
Additionally, as the owner of the MSR, we generally have the right to solicit our clients for refinance opportunities. We leverage our technology platform and data repository to continuously screen our servicing portfolio in an effort to anticipate borrower actions and capitalize on recapture opportunities. When a refinance opportunity is identified, the portfolio recapture team sends that opportunity to the loan officer who originated the existing loan and maintains the client relationship. For select refinance opportunities, our consumer direct team will originate the opportunity directly.
Our Growth Strategies
Expansion into New Markets and Products
We regularly evaluate opportunities to grow our business, including expansion into new markets through acquisitions and organic growth through the recruitment of loan officers. Our retail operations cover 32 states and we believe by continuing to execute our growth strategy, we can grow our geographic footprint to include all 50 states over the long term. Our loan officer recruitment activities leverage our proprietary technology solutions to identify and recruit purchase-mortgage focused loan officers. We continue to develop new products to satisfy demand from clients in each of our origination channels and respond to changing circumstances in the market for mortgage-related financing.
We have successfully completed numerous acquisitions. Potential targets need to share our values and our commitment to innovation, creativity and collaboration. We prefer to partner with lenders that have a strong foothold in their market and a clearly defined approach to sustaining that success. Following an acquisition, we fully integrate each business operationally, on-boarding the acquired business to our platform, while allowing its management team to continue executing the strategy that has been successful for them in the past. After a target business has been integrated into the Guild platform, we strive to support growth organically in the same way we do in our existing markets. We also strive to generate synergies and support profitability by improving execution and increasing gain-on-sale margins for the businesses that we acquire.
Growing Retail Originations through Portfolio Recapture
In addition to targeting acquisitions and loan officers in new markets to grow our retail channel we also focus on recapturing our own portfolio. Recapture exists when we refinance a current client’s loan or when we help originate a current client’s new home purchase. By doing so, we continue the relationship with the client which presents not only an extended servicing revenue stream, but additional future origination opportunities. For the years ended December 31, 2020 and 2019, our recapture rate was 60% and 56%, respectively. For the years ended December 31, 2020 and 2019, our refinance recapture rate was 66% and 64%, respectively.
Growing our Mortgage Loan Servicing Portfolio
Our strategy is to retain a client for life and one of the ways we execute this strategy is to retain the mortgage servicing right after a loan is originated and sold to the secondary market. Through this strategy we expect to grow our overall servicing portfolio by adding new customers and retaining current customers within the portfolio.
Internally-Developed Technology Platform Underpins Loan Officer Productivity and Fosters Repeat Business
Our technology is differentiated in that we have one homegrown integrated platform for servicing and production. As a result, we control our lending process from start to finish and have created a personalized client experience from the time a loan officer takes an application through a loan’s closing, and until the loan pays off and we have an opportunity to recapture the client’s next transaction. The key components of this technology stack include:
|
|
• |
Guild to Go – A partner portal application that enables seamless interaction between Guild’s sales teams and our large referral partner network by providing an easy referral process, on-demand pre-approval letters and real-time milestone tracking |
|
|
• |
MyMortgage – A consumer digital interface that delivers a web- and mobile-friendly application process, document collection capabilities, client messaging and income/asset verification options |
|
|
• |
MyKey – Our proprietary Loan Origination System (“LOS”) that facilitates program eligibility and pricing, application review, underwriting, closing and servicing functions all on one integrated platform with built-in controls aimed to drive scalable operational efficiencies and favorable unit economics |
|
|
• |
Guild360 – A sales platform that supports marketing automation, email and calendar sync, lead and loan activity tracking, portfolio, servicing and retention campaigns, automated workflows and task assignments, texting and video functionality and predictive lead analytics capabilities supported by third-party data integration |
Our one proprietary platform drives loan officer productivity, operational scale and favorable unit economics. Our experienced loan officers use this end-to-end technology platform and our custom-built client relationship
6
management system to find new clients, close new loans and enhance and expand existing client relationships. This technology platform and our data repository has been developed over the course of our long operating history. By utilizing this data to further develop our platform and to curate suggested customer touchpoints, we foster a balanced combination of personalized and digital strategies for lead nurturing, as well as client education and communication, that we believe gives our loan officers a competitive edge.
In addition, our technology platform adds substantial value to loan officers that cannot be replicated or transferred to our peers. This helps us to generate strong loan officer loyalty and benefit from high retention rates among our top performing loan officers.
The majority of our technology used throughout our company is proprietary and developed internally by our own employees. We rely on a combination of trade secret laws and contractual agreements to establish, maintain and protect our intellectual property rights and technology. We enter into confidentiality and invention assignment agreements with our employees and enter into confidentiality agreements with third parties, including suppliers and other partners.
U.S. Mortgage Market and Competition
Mortgage loans are the largest class of consumer debt in the United States. According to the New York Federal Reserve, there was approximately $11.5 trillion of residential mortgage debt outstanding as of September 30, 2020. According to Inside Mortgage Finance, first lien mortgage loan origination volume was approximately $4.0 trillion in 2020.
The residential mortgage industry is characterized by high barriers to entry. Mortgage lenders must obtain approval from Freddie Mac, Fannie Mae and Ginnie Mae and maintain various state licenses in order to originate, sell and service conventional conforming and federal and GSE-backed loans. In addition, sophisticated technology, origination and servicing processes and regulatory expertise are required to build and manage a successful mortgage business.
The mortgage lending market is highly competitive. We compete with large financial institutions and with other independent residential mortgage loan producers and servicers. Competition can occur on the basis of the variety of product offerings, speed and convenience of execution in loan origination, interest rates and fees, client experience, technical knowledge, marketing and referral relationships. We aim to differentiate our products and services on the basis of our loan officers’ ability, leveraging our technology platform to match customers with the loan programs that best suit their needs and providing a customer-focused and seamless borrowing experience, starting from origination and continuing through servicing.
The mortgage origination industry can be seasonal. Accordingly, our loan origination revenues varies from quarter to quarter and comparisons of sequential quarters may not be meaningful.
Human Capital Resources
At the heart of our Company is our culture, grounded in strong values, innovation, creativity and collaboration. We believe our culture sets us apart and is the backbone of our success. It has enabled us to continuously innovate and evolve to navigate the dynamic mortgage market. This has given us the ability to attract, develop and retain top talent throughout our organization. As of December 31, 2020 we employed approximately 4,400 employees throughout the United States.
Guild is an inclusive organization and encourages open and honest dialogue across employees, clients and partners. We have a diverse leadership team that fills key roles in each of our business lines. Our leadership team has an average of 24 years of industry experience, has worked at Guild for an average of 21 years and includes top performers from the businesses that Guild has acquired. We have high employee retention, as well as a successful recruiting program, because we empower our employees, maintain a culture that supports collaboration and development and provide our employees with the tools and resources they need to be successful. Over the last 5 years, ending December 31, 2020, 80% of our originations are produced from loan officers who are still with us today.
Employee Retention and Development
We empower our loan officers through the Company’s coaching program, Elevate, designed to support loan officers at each stage of their careers. Elevate provides a roadmap to develop highly productive partnerships with referral networks. The program is taught by our highest producing loan officers and allows participants to learn effective solutions from their peers. The program also furthers our goal of creating a collaborative culture by engaging our national sales team to share best practices with their peers around the country. Participating loan officers have consistently achieved increased average productivity following participation in the program.
We have an internal online training system, Guild University, that is focused on all aspects of employee training, including employee development, productivity, management, and compliance.
Community Involvement
We believe strongly in supporting the communities in which we operate. To that end, Guild and its employees give back to the neighborhoods and communities we serve through sustained investment of time and resources, including through our Guild Giving Foundation. As encouragement to continue to give back to communities, Guild offers paid time off to our employees for volunteer hours. In addition, Guild Giving partially matches employee contributions to charities of their choosing. Throughout our branch locations as well as our corporate headquarters in San Diego, local community involvement is a continual part of connecting with the neighborhoods we serve. Being
7
involved in our local communities not only drives employee engagement, it also develops our referral network and enhances business relationships.
Employee Safety
The wellbeing and safety of our employees has always been a priority. In response to the COVID-19 pandemic, starting in March 2020, we moved to a remote working environment for the majority of our employees and, for those who are coming into our offices, we have instituted additional health and safety precautions, such as restricting visitors, providing masks and mandating more frequent sanitizing of our offices.
Regulation
The mortgage industry is subject to a highly complex legal and regulatory framework. Our business is subject to extensive regulation and oversight by federal, state and local governmental authorities, including the CFPB and various state licensing, supervisory and administrative agencies. From time to time, we also receive requests from such governmental authorities for records, documents and information relating to the policies, procedures and practices of our loan servicing, origination and collection activities. In addition, we are also subject to periodic reviews and audits from the GSEs, Ginnie Mae, the CFPB, HUD, the USDA, the VA, state regulatory agencies and others. The legal and regulatory environment in which we operate is also constantly evolving as statutes, regulations and practices, and interpretations thereof, that are in place may be amended or otherwise change, and new statutes, regulations and practices may be enacted, adopted or implemented.
These and other laws and regulations directly affect our business and require constant compliance monitoring and internal and external audits and examinations by federal and state regulators. We work diligently to assess and understand the implications of the complex regulatory environment in which we operate and strive to meet the requirements of this constantly changing environment. We dedicate substantial resources to regulatory compliance while at the same time striving to meet the needs and expectations of our customers, clients and other stakeholders. Notwithstanding these efforts, there can be no assurance that we will be able to remain in compliance with these requirements. See “Risks Related to Regulatory Environment” under the section titled “Risk Factors.”
Federal Regulation
We are subject to a number of federal consumer protection laws, including:
|
|
• |
the Real Estate Settlement Procedures Act (the “RESPA”) and Regulation X thereunder, which, among other things, (i) require certain disclosures to borrowers regarding the costs of mortgage loans, the administration of tax and insurance escrows, the transferring of servicing of mortgage loans, the response to consumer complaints, and payments between lenders and vendors of certain settlement services; and (ii) prohibit giving or accepting anything of value for the referral of real estate settlement services; |
|
|
• |
the Truth in Lending Act (the “TILA”) and Regulation Z thereunder, which, among other things, (i) require certain disclosures to borrowers about their mortgage loans, right to rescind some transactions, notices of transfer of ownership of mortgage loans, servicing rules involving payment processing, and adjustable rate mortgage change notices and periodic statements; (ii) require a reasonable and good faith determination by the lender that the borrower has the ability to repay the loan; (iii) require home ownership counseling for certain mortgage applicants and (iv) impose restrictions on loan originator compensation; |
|
|
• |
the Equal Credit Opportunity Act (“ECOA”) and Regulation B thereunder, which prohibit discrimination on the basis of age, race, color, sex, religion, marital status, national origin, receipt of public assistance or the exercise of any right under the Consumer Credit Protection Act in the extension of credit and require certain disclosures to credit applicants; |
|
|
• |
the Fair Housing Act, which prohibits discrimination in housing on the basis of race, color, sex, national origin, religion, familial status or disability; |
|
|
• |
Regulation N (the Mortgage Acts and Practices Advertising Rule), which prohibits deceptive claims in mortgage advertising and other commercial communications; |
|
|
• |
certain provisions of the Dodd-Frank Act, including the Consumer Financial Protection Act, which, among other things, prohibit unfair, deceptive or abusive acts or practices; |
|
|
• |
the Federal Trade Commission Act, the FTC Credit Practices Rules and the FTC Telemarketing Sales Rule, which forbids unfair or deceptive acts or practices and certain related practices; |
|
|
• |
the Telephone Consumer Protection Act (“TCPA”) and related laws that regulate communications via telephone, text, automatic telephone dialing systems, and artificial and prerecorded voices; |
|
|
• |
the Controlling the Assault of Non-Solicited Pornography and Marketing Act, which establishes requirements for those who send unsolicited commercial email; |
|
|
• |
the Fair Credit Reporting Act, as amended by the Fair and Accurate Credit Transactions Act, and Regulation V, which, among other things, regulate the use and reporting of information related to the credit history of borrowers; |
8
|
|
• |
the Home Mortgage Disclosure Act, and Regulation C thereunder, which require financial institutions to collect and report certain loan application, origination and purchase data; |
|
|
• |
the Gramm-Leach-Bliley Act and Regulation P thereunder, which, among other things, require the maintenance of privacy with respect to certain consumer data and periodic communications with consumers on privacy matters; |
|
|
• |
the Homeowners Protection Act, which requires the cancellation of private mortgage insurance once certain equity levels are reached, sets disclosure and notification requirements, and requires the return of unearned premiums; |
|
|
• |
the Secure and Fair Enforcement for Mortgage Licensing Act (“SAFE Act”), which requires all states to enact laws requiring each individual who originates residential mortgage loans to be licensed or registered as a mortgage loan originator; |
|
|
• |
federal anti-money laundering laws, including the Bank Secrecy Act and the Uniting and Strengthening America by Providing Appropriate Tools Required to Intercept and Obstruct Terrorism Act, and the implementing regulations and sanctions programs of the United States Department of the Treasury; |
|
|
• |
the Electronic Fund Transfer Act of 1978 and Regulation E, thereunder, which provide certain protections for consumers engaging in electronic fund transfers; |
|
|
• |
federal financial protection statutes applicable to certain eligible service members, including the Military Lending Act and Servicemembers Civil Relief Act; and |
|
|
• |
the Bankruptcy Code and bankruptcy injunctions and stays, which can restrict collection of debts. |
We are also subject to a variety of regulatory and contractual obligations imposed by Fannie Mae, Freddie Mac, Ginnie Mae, the VA, the FHA and others.
In addition, the CFPB was established on July 21, 2010 under Title X of the Dodd-Frank Act to ensure that consumers receive clear and accurate disclosures regarding financial products and to protect consumers from unfair, deceptive or abusive acts or practices, among other things. The CFPB influences the regulation of residential mortgage loan originations and servicing in several ways. The CFPB has rulemaking authority with respect to many of the federal consumer protection laws applicable to mortgage originators and servicers, such as us, including the TILA, RESPA and the ECOA. The CFPB has been active and continues to amend rules and regulations within its purview. For example, the CFPB has issued rules and regulations that have expanded the scope of data required to be collected and reported for loan applicants and imposed requirements relating to repayment ability and qualified mortgage standards. These rules impose significant compliance burdens, for example, by requiring us to collect and submit data to regulators and to retain evidence of compliance, and any failures to comply, including any inadvertent errors, could result in the CFPB or other regulators imposing fines on or taking other enforcement actions relating to us.
The CFPB’s jurisdiction includes those persons originating, brokering, servicing or collecting residential mortgage loans and those persons performing loan modification or foreclosure relief services in connection with such loans. The CFPB has broad supervisory and enforcement powers with regard to non-depository institutions, such as us, that engage in the origination and servicing of home loans. The CFPB has conducted routine examinations of our business and we expect it to conduct future examinations. The CFPB can also bring enforcement actions, impose monetary penalties, require remediation of practices, pursue administrative proceedings or litigation and obtain cease and desist orders for violations of applicable federal consumer financial laws. The CFPB has been active in investigations and enforcement actions and has issued civil money penalties to parties when the CFPB has determined that such parties have violated the laws and regulations it enforces.
State Regulation
The SAFE Act requires all states to have laws that require individual mortgage loan originators employed by non-depository institutions, such as us, to be licensed to offer mortgage loan products. States also impose entity- and branch-level licensing obligations on us. As a result, we are subject to various state licensing requirements. These state licensing requirements generally require individual loan originators to register in a nationwide licensing system, submit information for a character and fitness review, submit to a criminal background check, complete a minimum number of hours of pre-licensing education, complete an annual minimum number of hours of continuing education and successfully complete an examination. Upon issuance of a license, we become subject to regulatory oversight, supervision and enforcement activity to determine compliance with applicable law. To conduct our residential mortgage operations in the United States, we are licensed in 48 states and the District of Columbia.
In addition to the above, state laws and regulations, among other things:
|
|
• |
require the filing of reports with regulators and compliance with state regulatory capital requirements; |
|
|
• |
impose maximum terms, amounts and interest rates, and limit other charges; |
|
|
• |
impose consumer privacy rights and other obligations that may require us to notify customers, employees, state attorneys general, regulators and others in the event of a security breach; |
|
|
• |
regulate servicing activities, including disclosures, payment processing, loss mitigation and foreclosure, servicing fees and escrow account administration; |
9
|
|
• |
prohibit discrimination and various forms of “predatory” lending and place obligations on lenders to substantiate that a client will derive a tangible benefit from the proposed home financing transaction and/or have the ability to repay the loan; |
|
|
• |
regulate whether and under what circumstances we may offer insurance and other ancillary products in connection with a lending transaction; and |
|
|
• |
provide for additional consumer protections. |
State laws and regulations, and interpretations thereof, vary from state to state, and these laws, regulations and interpretations may change and/or may be vague or interpreted only rarely.
Additionally, our business is subject to numerous state laws that are continuously changing, including laws related to mobile- and internet-based businesses, data privacy (including the California Consumer Privacy Act and similar or other data privacy laws enacted by other states) and advertising laws. One of our subsidiaries, Mission Village Insurance Agency, is also subject to certain laws and regulations governing insurance activities.
State attorneys general, state licensing regulators and state and local consumer protection offices also have the authority to investigate consumer complaints, commence investigations and other formal and informal proceedings, and take enforcement actions and impose remedies on or regarding our operations and activities.
See also “Risks Related to Regulatory Environment” under the section titled “Risk Factors.”
Available Information
Our corporate website address is https://www.guildmortgage.com. The content of our website is not intended to be incorporated by reference into this Annual Report or in any other report or document we file and any references to these websites are intended to be inactive textual references only.
ITEM 1A. RISK FACTORS
Investing in our Class A common stock involves risks. You should carefully consider the risks and uncertainties described below, together with all of the other information included in this Annual Report, including the financial statements and the related notes included in Item 8 of this Annual Report. Our business, financial condition, operating results, cash flow and prospects could be materially and adversely affected by any of these risks or uncertainties. In that case, the trading price of our Class A common stock could decline, and you could lose all or part of your investment. The risks and uncertainties described below are not the only ones we face. Additional risks and uncertainties that we are unaware of or that we currently see as immaterial may also adversely affect our business. Some statements in this Annual Report, including statements included in the following risk factors, constitute forward-looking statements. Please refer to “Cautionary Note Regarding Forward-Looking Statements.”
Risks Related to Our Business
The COVID-19 pandemic has had, and will likely continue to have, an adverse effect on our business, and its ultimate effect on our business and financial results will depend on future developments, which are highly uncertain and cannot be predicted, including the scope and duration of the pandemic and actions taken or to be taken by government authorities in response to the pandemic.
The COVID-19 pandemic has negatively affected, and continues to negatively affect, the national economy and the local economies in the communities in which we operate and has created unprecedented economic, financial and health disruptions that have, and will likely continue to have, an adverse effect on our business. The pandemic has also caused significant volatility and disruption in the financial markets. In the event of a prolonged economic downturn or other economic disruption or changes in the broader economy, housing market, debt markets or otherwise, real estate transactions, the volume of mortgages we originate and the value of the homes that serve as collateral for the loans that we service may decrease significantly.
The COVID-19 pandemic is also affecting our mortgage servicing operations. The federal government enacted the Coronavirus Aid, Relief, and Economic Security Act (the “CARES Act”), which allowed borrowers with federally backed loans to request a temporary mortgage forbearance. In February 2021, the Federal Housing Finance Agency, the Department of Housing and Urban Development, the Department of Veterans Affairs, and the Department of Agriculture announced an extension of the forbearance period of three to six months depending on the loan type. As a result of the CARES Act forbearance requirements and the subsequent extension of federal forbearance programs, we have recorded, and expect to record additional, increases in delinquencies in our servicing portfolio, which may require us to finance substantial amounts of advances of principal and interest, property taxes, insurance premiums and other expenses to protect investors’ interests in the properties securing the loans. We expect that a borrower who has experienced a loss of employment or a reduction of income may not repay the forborne payments at the end of the forbearance period, or at all. Additionally, we are prohibited from collecting certain servicing-related fees, such as late fees, and initiating foreclosure proceedings. As a result, we expect the effects of the CARES Act forbearance requirements to reduce our servicing income, increase our servicing expenses and require significant unreimbursed cash outlays.
The COVID-19 pandemic may also affect our liquidity. We fund substantially all of the mortgage loans we close through borrowings under our loan funding facilities. Given the broad impact of COVID-19 on the financial markets, our future ability to borrow money to fund our current and future loan production and other cash needs is unknown. Our mortgage origination liquidity could also be affected if our lenders curtail access to uncommitted mortgage warehouse financing capacity or impose higher costs to access such capacity. Our liquidity may be further constrained as there may be less demand by investors to acquire our mortgage loans in the secondary market. In
10
addition, we may be required to use significant amounts of cash to fund advances for loans subject to forbearance requirements or that are delinquent.
Our business operations may also be disrupted if significant portions of our workforce are unable to work effectively, including because of illness, quarantines, government actions or other restrictive measures in connection with the pandemic. As a result of the pandemic, a significant portion of our employees has been working remotely. Although government authorities are in varying stages of lifting or modifying some of these measures, some have already, and others may in the future, reinstitute these measures or impose new, more restrictive measures if the risks, or the perception of the risks, related to the COVID-19 pandemic worsen at any time. Such restrictive measures could also slow certain aspects of our operations that depend on third parties such as appraisers, closing agents and others for loan-related verifications.
The extent to which the COVID-19 pandemic affects our business, results of operations, and financial condition will ultimately depend on future developments that are highly uncertain and cannot be predicted, including the scope and duration of the pandemic and actions taken by governmental authorities and other third parties in response to the pandemic.
A disruption in the secondary home loan market or our ability to sell the loans that we originate could have a detrimental effect on our business.
Demand in the secondary market for home loans and our ability to sell the mortgages that we originate depend on many factors that are beyond our control, including general economic conditions, the willingness of lenders to provide funding for and purchase home loans and changes in regulatory requirements. Our inability to sell the mortgages that we originate in the secondary market in a timely manner and on favorable terms could be detrimental to our business. In particular, we sell the majority of the mortgages that we originate to Fannie Mae, Freddie Mac and Ginnie Mae, and the gain recognized from these sales represents a significant portion of our revenues and net earnings. If it is not possible or economical for us to continue selling mortgages to the GSEs or other loan purchasers, our business, prospects, financial condition and results of operations could be materially and adversely affected.
Macroeconomic and U.S. residential real estate market conditions could materially and adversely affect our revenue and results of operations.
Our business has been, and will continue to be, affected by a number of factors that are beyond our control, including the health of the U.S. residential real estate industry, which is seasonal, cyclical, and affected by changes in general economic conditions, including the effects of the COVID-19 pandemic. Furthermore, our clients’ and potential clients’ income, and thus their ability and willingness to make home purchases and mortgage payments, may be negatively affected by macroeconomic factors such as unemployment, wage deflation, changes in property values and taxes and the availability and cost of credit. As a result, these macroeconomic factors can adversely affect our origination volume.
Increased delinquencies could also increase the cost of servicing existing mortgages and could be detrimental to our business. Lower servicing fees could result in decreased cash flow, and also could decrease the estimated value of our MSRs, resulting in recognition of losses when we write down those values. In addition, an increase in delinquencies lowers the interest income we receive on cash held in collection and other accounts and increases our obligation to advance certain principal, interest, tax and insurance obligations owed by the delinquent mortgage loan borrower.
We highly depend on certain U.S. government-sponsored entities and government agencies, and any changes in these entities or their current roles could materially and adversely affect our business, financial condition and results of operations.
A substantial portion of the loans we originate are loans eligible for sale to Fannie Mae and Freddie Mac, and government insured or guaranteed loans, such as loans backed by the FHA, the VA and the USDA eligible for Ginnie Mae securities issuance. The future of Fannie Mae and Freddie Mac (the “GSEs”), is uncertain, including with respect to how long they will continue to be in existence, the extent of their roles in the market and what forms they will have, and whether they will be government agencies, government-sponsored agencies or private for-profit entities. If the operation of the GSEs is discontinued or reduced, if there is a significant change in their capital structure, financial condition, activity levels or roles in the primary or secondary mortgage markets or in their underwriting criteria or if we lose approvals with those agencies or our relationships with those agencies is otherwise adversely affected, our business, financial condition and results of operations could be adversely affected.
Changes in prevailing interest rates or U.S. monetary policies may have a detrimental effect on our business. Our hedging strategies may not be successful in mitigating interest rate risk.
Our profitability is directly affected by changes in interest rates. The market value of closed loans held for sale and interest rate locks generally change along with interest rates. As such, volatility in prevailing interest rates may have a detrimental effect on our financial performance and results of operations. Many factors beyond our control impact interest rates, including economic conditions, governmental monetary policies, inflation, recession, changes in unemployment, the money supply, and disorder and instability in domestic and foreign financial markets. Changes in monetary policies of the Federal Reserve System could influence not only consumer demand for mortgages but also the fair value of our financial assets and liabilities.
We pursue hedging strategies to mitigate our exposure to adverse changes in interest rates, including with respect to loans held for sale and interest rate locks. Hedging interest rate risk, however, is a complex process, requiring sophisticated models and constant monitoring, and is not a perfect science. Due to interest rate fluctuations, hedged assets and liabilities will appreciate or depreciate in market value. The effect of this unrealized appreciation or depreciation will generally be offset by income or loss on the derivative instruments that are linked
11
to the hedged assets and liabilities. If we engage in derivative transactions, we will be exposed to credit and market risk. If a counterparty fails to perform, counterparty risk exists to the extent of the fair value gain in the derivative. Interest rate risk exists to the extent that interest rates change in ways that are significantly different from what we expected when we entered into the derivative transaction. In addition, we may not engage in hedging strategies with respect to all or a portion of our exposure to changes in interest rates at any given time, or may engage in hedging strategies to a degree or in a manner that is different from that of other companies in our industry. Failure to manage interest rate risk could have a material adverse effect on our business.
Our servicing rights are subject to termination with or without cause.
The servicing agreements under which we service mortgage loans for GSE and non-GSE loan purchasers require that we comply with certain servicing guidelines and abide by certain financial covenants. Under the terms of our master servicing agreements with the GSEs and non-GSEs that purchase the loans we originate, the loan purchasers generally retain the right to terminate us as servicer of the loans we service on their behalf, with or without cause. If we were to have our MSRs terminated on a material portion of our servicing portfolio, or if our costs related to servicing mortgages were increased by the way of additional fees, fines or penalties or an increase in related compliance costs, this could materially and adversely affect our business.
Our existing and any future indebtedness could adversely affect our ability to operate our business, our financial condition or the results of our operations.
Our existing and any future indebtedness could have important consequences, including:
|
|
• |
requiring us to dedicate a substantial portion of our cash flow to payments on our indebtedness, which would reduce the amount of cash flow available to fund working capital, capital expenditures or other corporate purposes; |
|
|
• |
increasing our vulnerability to general adverse economic, industry and market conditions; |
|
|
• |
subjecting us to restrictive covenants that may reduce our ability to take certain corporate actions or obtain further debt or equity financing; |
|
|
• |
limiting our ability to plan for and respond to business opportunities or changes in our business or industry; and |
|
|
• |
placing us at a competitive disadvantage compared to our competitors that have less debt or better debt servicing options. |
Failure to make payments or comply with other covenants under our existing debt instruments could result in an event of default. If an event of default occurs and the lender accelerates the amounts due, we may need to seek additional financing, which may not be available on acceptable terms, in a timely manner or at all. In that event, we may not be able to make accelerated payments, and the lender could seek to enforce security interests in the collateral securing such indebtedness, which includes substantially all of our assets.
Our mortgage loan origination and servicing activities rely on our loan funding facilities to fund mortgage loans and otherwise operate our business. If one or more of those facilities are terminated, we may be unable to find replacement financing at commercially favorable terms, or at all, which could be detrimental to our business.
We fund substantially all of the mortgage loans we close through borrowings under our loan funding facilities and funds generated by our operations. Our borrowings are in turn generally repaid with the proceeds we receive from mortgage loan sales. We currently, and may in the future continue to, depend upon several lenders to provide the primary funding facilities for our loans. As of the date of this Annual Report, we had eight warehouse lines of credit pursuant to master repurchase agreements, which provide us with an aggregate maximum borrowing capacity of approximately $3.0 billion. Additionally, as of December 31, 2020, we were party to (i) a term loan credit agreement with one of our warehouse banks, which agreement is collateralized by our Fannie Mae MSRs and provides for a term loan facility of $100.0 million (which can be increased to up to $150.0 million), (ii) a loan and security agreement with one of our warehouse banks, which agreement is collateralized by our Ginnie Mae MSRs and provides for a revolving facility of up to $135.0 million (which can be increased to up to $200.0 million) and (iii) a loan and security agreement with one of our warehouse banks, which agreement is collateralized by our Freddie Mac MSRs and provides for a revolving facility of up to $65.0 million.
In the event that any of our loan funding facilities is terminated or is not renewed, or if the principal amount that may be drawn under our funding agreements were to decrease significantly, we may be unable to find replacement financing on commercially favorable terms, or at all, which could be detrimental to our business. Further, if we are unable to refinance or obtain additional funds for borrowing, our ability to maintain or grow our business could be limited.
Our ability to refinance existing debt and borrow additional funds is affected by a variety of factors, including:
|
|
• |
limitations imposed under existing and future financing facilities that contain restrictive covenants and borrowing conditions that may limit our ability to raise additional debt; |
|
|
• |
a decline in liquidity in the credit markets; |
|
|
• |
prevailing interest rates; |
|
|
• |
the financial strength of the lenders from whom we borrow; |
|
|
• |
the decision of lenders from whom we borrow to reduce their exposure to mortgage loans due to a change in such lenders’ strategic plan, future lines of business or otherwise; |
12
|
|
• |
the amount of eligible collateral pledged on advance facilities, which may be less than the borrowing capacity of the facility; |
|
|
• |
the large portion of our loan funding facilities that is uncommitted; |
|
|
• |
more stringent financial covenants in our refinanced facilities, with which we may not be able to comply; and |
|
|
• |
accounting changes that impact calculations of covenants in our debt agreements. |
If the refinancing or borrowing guidelines become more stringent and those changes result in increased costs to comply or decreased origination volume, those changes could be detrimental to our business.
Our loan funding facilities contain covenants that include certain financial requirements, including maintenance of maximum adjusted leverage ratio, minimum net worth, minimum tangible net worth, minimum current ratio, minimum liquidity, positive quarterly income and other customary debt covenants, as well as limitations on additional indebtedness, dividends, sales of assets, and declines in the mortgage loan servicing portfolio’s fair value. A breach of these covenants can result in an event of default under these facilities and as such allow the lenders to pursue certain remedies. In addition, our loan facilities include cross default or cross acceleration provisions that could result in most, if not all, facilities terminating if an event of default or acceleration of maturity occurs under a facility. If we are unable to meet or maintain the necessary covenant requirements or satisfy, or obtain waivers for, the continuing covenants, we may lose the ability to borrow under all of our financing facilities, which could be detrimental to our business.
Our business depends on our ability to maintain and improve the technology infrastructure that supports our origination and servicing platform, and any significant disruption in service on our platform could harm our business, brand, operating results, financial condition and prospects.
Our ability to service our clients depends on the reliable performance of our technology infrastructure. Interruptions, delays or failures in these systems, whether due to adverse weather conditions, natural disasters, power loss, computer viruses, cybersecurity attacks, physical break-ins, terrorism, hardware failures, errors in our software or otherwise, could be prolonged and could affect the security or availability of our platform and our ability to originate and service mortgages. Furthermore, we may incur significant expense maintaining, updating and adapting our technology infrastructure, and our disaster recovery planning may be insufficient to prevent or mitigate these and other events or occurrences. The reliability and security of our systems, and those of certain third parties, is important not only to facilitating our origination and servicing of mortgages, but also to maintaining our reputation and ensuring the proper protection of our confidential and proprietary information and the data of mortgage borrowers and other third parties that we possess or control or to which we have access. Operational failures or prolonged disruptions or delays in the availability of our systems could harm our business, brand, reputation, operating results, financial condition and prospects.
Our risk management strategies may not be fully effective in mitigating our risk exposures in all market environments or against all types of risk.
We have devoted significant resources to develop our risk management policies and procedures and expect to continue to do so in the future. Nonetheless, our risk management strategies may not be fully effective in mitigating our risk exposure in all market environments or against all types of risk, including market, interest rate, credit, liquidity, operational, cybersecurity, legal, regulatory and compliance risks, as well as other risks that we may not have identified or anticipated. As our products and services change and grow and the markets in which we operate evolve, our risk management strategies may not always adapt to those changes in a timely or effective manner. Some of our methods of managing risk are based upon our use of observed historical market behavior and management’s judgment. As a result, these methods may not predict future risk exposures, which could be different or significantly greater than the historical measures indicate. Although we employ a broad and diversified set of risk monitoring and risk mitigation techniques, those techniques and the judgments that accompany their application cannot anticipate every economic and financial outcome or the timing of such outcomes. Any of these circumstances could have an adverse effect on our business, financial condition and results of operations.
Pressure from existing and new competitors may adversely affect our business, operating results, financial condition and prospects.
We operate in a highly competitive industry that could become even more competitive due to economic, legislative, regulatory and technological changes. We face significant competition for clients from bank and non-bank competitors, including national and regional banks, mortgage banking companies, financial technology companies and correspondent lenders. Many of our competitors are significantly larger and have significantly more resources, greater name recognition and more extensive and established retail footprints than we do.
Our ability to compete successfully will depend on a number of factors, including our ability to build and maintain long-term client relationships while ensuring high ethical standards and sound lending and servicing practices, the scope, relevance and pricing of products and services that we offer, our clients’ satisfaction with our products and services, industry and general economic trends and our ability to keep pace with technological advances in the industry.
Our failure to compete effectively in our markets could restrain our growth or cause us to lose market share, which could have a material adverse effect on our business, prospects, financial condition and results of operations. We may also face a competitive disadvantage as a result of our concentration in the northwest United States and will be unable, as compared to our more geographically diversified peers, to spread our operating costs across a broader market. Furthermore, a cyclical decline in the industry’s overall level of originations, or decreased demand for loans due to a higher interest rate environment, may lead to increased competition for remaining loan originations. Any
13
increase in these competitive pressures could have an adverse effect on our business, prospects, financial condition and results of operations.
Our failure to maintain or grow our historical referral relationships with our referral partners may materially and adversely affect our business, operating results, financial condition and prospects.
A substantial portion of our mortgage origination leads are sourced through an established network of referral partners with which we have longstanding relationships. We rely on being a preferred provider to realtors, builders and other partners with whom we have relationships. Our failure to maintain or grow these relationships could significantly decrease our origination volume and materially and adversely affect our business, operating results, financial condition and prospects. In addition, changes in the real estate and home construction industries, or in the relationships between those industries and the mortgage industry, could adversely affect our business and operating results, financial condition and prospects. For example, in recent years, there has been an increase in products and services designed to facilitate home sales without the involvement of realtors, and if the role of realtors in the sales process declines, our business could be adversely affected if we are unable to adapt to that development in a manner that preserves our loan origination leads.
We are required to make servicing advances that can be subject to delays in recovery or may not be recoverable in certain circumstances.
During any period in which our clients are not making payments on loans we service, including during defaults, delinquencies, forbearances and in certain circumstances where a client prepays a loan, we generally are required under our servicing agreements to advance our own funds to pay principal and interest, property taxes and insurance premiums, legal expenses and other expenses. In addition, in the event a loan serviced by us defaults or becomes delinquent, or to the extent a mortgagee under such loan is allowed to enter into a forbearance by applicable law or regulation, the repayment to us of any advance related to such events may be delayed until the loan is repaid or refinanced or liquidation occurs. Any delay or impairment in our ability to collect an advance may materially and adversely affect our liquidity, and delays in reimbursements of us, or our inability to be reimbursed, for advances could be detrimental to our business. Market disruptions such as the COVID-19 pandemic and the response, including through the CARES Act and the temporary period of forbearance that is being offered for clients unable to pay on certain mortgage loans may also increase the number of defaults, delinquencies or forbearances related to the loans we service, increasing the advances we make for such loans, which we may not recover in a timely manner or at all. In addition, any regulatory actions that lengthen the foreclosure process could increase the amount of servicing advances that we are required to make, lengthen the time it takes for us to be reimbursed for such advances and increase the costs incurred during the foreclosure process. While we have in the past utilized prepayments and payoffs to make advances, such sources, and other sources of liquidity available to us, may not be sufficient in the future, and our business, financial condition and results of operations could be materially and adversely affected as a result. As of December 31, 2020, loans representing approximately 3.5% of the loans in our servicing portfolio were in forbearance.
If we are unable to attract, integrate and retain qualified personnel, our ability to develop and successfully grow our business could be harmed.
Our business depends on our ability to retain our key executives and management and to hire, develop and retain qualified loan officers and other employees. Our ability to expand our business depends on our being able to hire, train and retain sufficient numbers of employees to staff our in-house servicing centers, as well as other personnel. Our success in recruiting highly skilled and qualified personnel can depend on factors outside of our control, including the strength of the general economy and local employment markets and the availability of alternative forms of employment. Furthermore, the spread of COVID-19 may adversely affect our ability to recruit and retain personnel. If the services of any of our key personnel should become unavailable for any reason, we may not be able to identify and hire qualified persons on terms acceptable to us, which could have a material and adverse effect on our business, operating results, financial condition and prospects.
A substantial portion of our assets are measured at fair value. If our estimates of their value prove to be inaccurate, we may be required to write them down, which could adversely affect our business and financial condition.
We record the value of our MSRs, interest rate lock commitments (“IRLCs”), mortgage loans held for sale (“MLHS”), the contingent liabilities related to our completed acquisitions and our inventory of loans for which we have repurchase rights at fair value. Fair value determinations require many assumptions and complex analyses for which we cannot control many of the underlying factors. If our estimates prove to be incorrect, we may be required to write down the value of these assets, which could adversely affect our earnings, financial condition and liquidity.
In particular, our estimates of the fair value of our MSRs are based on the cash flows projected to result from the servicing of the related mortgage loans and continually fluctuate due to a number of factors, including prepayment rates and other market conditions that affect the number of loans that ultimately become delinquent or are repaid or refinanced. These estimates are calculated by a third party using complex financial models that account for a high number of variables that drive cash flows associated with MSRs and anticipate changes in those variables over the life of the MSR. As such, the accuracy of our estimates of the fair value of our MSRs are highly dependent upon the reasonableness of the results of such models and the variables and assumptions that we build into them. If loan delinquencies or prepayment speeds are higher than anticipated or other factors perform worse than modeled, the recorded value of certain of our MSRs may decrease, which could adversely affect our business, financial condition and results of operations.
14
We may from time to time be subject to litigation, which may be extremely costly to defend, could result in substantial judgment or settlement costs and could subject us to other remedies.
From time to time, we have been, and may continue to be, involved in various legal proceedings, including, but not limited to, actions related to our lending and servicing practices as well as alleged violations of the local, state and federal laws to which our business is subject. See “Item 3 – Legal Proceedings.” Claims may be expensive to defend and may divert management’s time away from our operations, regardless of whether they are meritorious or ultimately lead to a judgment against us. We cannot assure you that we will be able to successfully defend or resolve any current or future litigation matters, and the resolution of such matters may result in significant financial payments by, or penalties imposed upon, us, restrictions on our business and operations, or other remedies, in which case those litigation matters could have a material and adverse effect on our business, operating results, financial condition and prospects.
The success and growth of our business will depend upon our ability to adapt to and implement technological changes.
The mortgage industry is continually undergoing rapid technological change with frequent introductions of new products and services. We seek to differentiate ourselves by the range of mortgage programs we offer and rely on our internally-developed technology to make our platform available to our loan officers, evaluate mortgage applicants and service loans. Our future success and growth depend, in part, upon our ability to develop new products and services that satisfy changing client demand and use technology to provide a desirable client experience and to create additional efficiencies in our operations. If we fail to predict demand and develop, commercially market and achieve acceptance of attractive products and services, our business and prospects could be adversely affected. In addition, the implementation of technological changes and upgrades to maintain current systems and integrate new ones may also cause service interruptions, transaction processing errors and system conversion delays, may cause us to fail to comply with applicable laws, and may cause us to incur additional expenses, which may be substantial. Failure to keep pace successfully with technological change affecting the mortgage industry and avoid interruptions, errors and delays could have material adverse effect on our business, financial condition or results of operations.
Adverse events to our clients could occur, which can result in substantial losses that could adversely affect our financial condition.
A client’s ability or willingness to repay his or her mortgage may be adversely affected by numerous factors, including a loss of or change in employment or income, weak macro-economic conditions, increases in payment obligations to other lenders and deterioration in the value of the home that serves as collateral for the loan. Increases in delinquencies or defaults related to these and other factors may adversely affect our business, financial condition, liquidity and results of operations and may also cause decreased demand in the secondary market for loans originated through Guild. In addition, higher risk loans incur greater servicing costs because they require more frequent interaction with clients and closer monitoring and oversight. We may not be able to pass along these additional servicing costs associated with higher-risk loans to our clients and they could result in substantial losses that could adversely affect our financial condition.
Our business could be materially and adversely affected by a cybersecurity breach or other vulnerability involving our computer systems or those of certain of our third-party service providers.
Our systems and those of certain of our third-party service providers could be vulnerable to hardware and cybersecurity issues. Our operations depend upon our ability to protect our computer equipment against damage from fire, power loss, telecommunications failure or a similar catastrophic event. We could also experience a breach by intentional or negligent conduct on the part of employees or other sources. Any damage or failure that causes an interruption in our operations or those of our third-party service providers could have an adverse effect on our business, operating results, financial condition and prospects. In addition, our operations depend upon our ability to protect the computer systems and network infrastructure we use against damage from cybersecurity attacks by sophisticated third parties with substantial computing resources and capabilities and other disruptive problems caused by the internet or other users. These disruptions could jeopardize the security of information stored in and transmitted through our computer systems and network infrastructure, including personal or confidential information of our clients, employees and others, which may result in significant liability and damage our reputation.
It is difficult or impossible to defend against every risk being posed by changing technologies as well as criminals intent on committing cyber-crime and any measures we employ may not be successful in preventing, detecting or stopping attacks. The increasing sophistication and resources of cyber criminals and other non-state threat actors and increased actions by nation-state actors make keeping up with new threats difficult and could result in a breach of security. Controls employed by our information technology department and our third-party service providers, including cloud vendors, could prove inadequate. A breach of our security that results in unauthorized access to our data could expose us to a disruption or challenges relating to our daily operations, as well as to data loss, litigation, damages, fines and penalties, significant increases in compliance costs and reputational damage, any of which could have a material and adverse effect on our business, operating results, financial condition and prospects.
A number of the states, counties and cities in which we maintain branch offices have issued shelter-in-place and similar orders in response to the COVID-19 pandemic. As a result, a significant portion of our employees has been working remotely. This transition to a remote work environment may exacerbate certain risks to our business, including increasing the stress on, and our vulnerability to disruptions of, our technology infrastructure and computer systems, increased risk of phishing and other cybersecurity attacks, and increased risk of unauthorized dissemination of personal or confidential information.
To the extent we or our systems rely on third-party service providers, through either a connection to, or an integration with, those third-parties’ systems, the risk of cybersecurity attacks and loss, corruption or unauthorized
15
publication of our information or the confidential information of our clients, employees and others may increase. Third-party risks may include ineffective security measures, data location uncertainty and the possibility of data storage in inappropriate jurisdictions where laws or security measures may be inadequate.
Any or all of the issues described above could adversely affect our ability to attract new clients and continue our relationship with existing clients and could subject us to governmental or third-party lawsuits, investigations, regulatory fines or other actions or liability, thereby harming our business, operating results, financial condition and prospects.
Operating and growing our business may require additional capital, and if capital is not available to us, our business, operating results, financial condition and prospects may suffer.
Operating and growing our business is expected to require further investments in our technology and operations. We may be presented with opportunities that we want to pursue, and unforeseen challenges may present themselves, any of which could cause us to require additional capital. If our cash needs exceed our expectations or we experience rapid growth, we could experience strain in our cash flow, which could adversely affect our operations in the event we were unable to obtain other sources of liquidity. If we seek to raise funds through equity or debt financing, those funds may prove to be unavailable, may only be available on terms that are not acceptable to us or may result in significant dilution to you or higher levels of leverage. If we are unable to obtain adequate financing or financing on terms satisfactory to us, when we require it, our ability to continue to pursue our business objectives and to respond to business opportunities, challenges or unforeseen circumstances could be significantly limited, and our business, operating results, financial condition and prospects could be materially and adversely affected.
We are subject to certain operational risks, including, but not limited to, employee or customer fraud, the obligation to repurchase sold loans in the event of a documentation error, and data processing system failures and errors.
Employee errors and employee and client misconduct could subject us to financial losses or regulatory sanctions and seriously harm our reputation. Misconduct by our employees could include, among other things, improper use of confidential information and fraud. It is not always possible to prevent employee errors and misconduct or documentation errors, and the precautions we take to prevent and detect this activity may not be effective in all cases. In addition, we rely heavily upon information supplied by third parties, including the information contained in credit applications, property appraisals, title information and valuation, employment and income documentation, in deciding which loans we will originate, as well as the terms of those loans. If any of the information upon which we rely is misrepresented, either fraudulently or inadvertently, and the misrepresentation is not detected prior to the mortgage being funded, the value of that mortgage may be significantly lower than expected, or we may fund a mortgage that we would not have funded or on terms we would not have extended. Whether a misrepresentation is made by the mortgage applicant or another third party, we generally bear the risk of loss associated with such misrepresentation. A loan subject to a material misrepresentation is typically unsellable or subject to repurchase if it is sold prior to detection of the misrepresentation. The sources of the misrepresentations are often difficult to identify, and it is often difficult to recover any of the monetary losses we may suffer. These risks could adversely affect our business, results of operation, financial condition and reputation.
We may be required to repurchase mortgage loans that we have sold, or indemnify purchasers of our mortgage loans, if these loans fail to meet certain criteria or characteristics or under other circumstances.
At the time a loan is sold to an investor, we make certain representations and warranties. If defects are subsequently discovered in these representations and warranties that cause a loan to no longer satisfy the applicable investor eligibility requirements, we may be required to repurchase that loan. We are also required to indemnify several of our investors for borrowers’ prepayments and defaults. In addition, with respect to delinquent Ginnie Mae mortgage loans that we service, we are required to repurchase such loans prior to foreclosing and liquidating the mortgaged properties securing such loans. For the year ended December 31, 2020, Ginnie Mae accounted for 33.2% of the UPB of our servicing portfolio.
As of December 31, 2020, we have a reserve of $14.5 million for repurchase and indemnification obligations. Actual repurchase and indemnification obligations could materially exceed the reserves we have recorded in our financial statements. There can be no guarantee that future losses will not be in excess of the recorded liability.
Seasonality may cause fluctuations in our financial results.
The mortgage origination industry can be seasonal. We typically experience an increase in our mortgage origination activity during the second and third quarters and reduced activity in the first and fourth quarters as homebuyers tend to purchase their homes during the spring and summer in order to move to a new home before the start of the school year. Accordingly, our loan origination revenues varies from quarter to quarter and comparisons of sequential quarters may not be meaningful.
If we fail to protect our brand and reputation, our ability to grow our business and increase the volume of mortgages we originate and service may be adversely affected.
Maintaining strong brand recognition and a reputation for trustworthiness and for delivering a superior client experience is important to our business. If we fail to protect our brand and deliver on these expectations, or if negative public opinion relating to Guild or other mortgage industry participants resulting from actual or alleged conduct in mortgage origination, servicing or other activities, government oversight or regulation, litigation or other matters should occur, these events could harm our reputation and damage our ability to attract and retain clients or maintain our referral network, which could adversely affect our business.
16
We could be forced to incur greater expense marketing our brand or maintaining our reputation in the future to preserve our position in the market and, even with such greater expense, we may not be successful in doing so. Many of our competitors have more resources than we do and can spend more advertising their brands and services. If we are unable to maintain or enhance consumer awareness of our brand cost-effectively and maintain our reputation, or otherwise experience negative publicity, our business, operating results, financial condition and prospects could be materially and adversely affected.
Failure to comply with fair lending laws and regulations could lead to a wide variety of sanctions that could have a material adverse effect on our business, financial condition and results of operations.
Antidiscrimination statutes, such as the Fair Housing Act, the ECOA and other fair lending laws and regulations prohibit creditors from discriminating against loan applicants and borrowers based on certain characteristics, such as race, religion and national origin. The Department of Justice and other federal agencies, including the CFPB, are responsible for enforcing these laws and regulations. The Supreme Court has held that the Fair Housing Act applies not just to intentional discrimination, but also to neutral practices that have a disparate impact on protected classes. Enforcement agencies have taken a similar position in connection with the applicability of ECOA. Compliance with anti-discrimination prohibitions, and particularly the disparate impact theory, creates a significant administrative burden and potential liability for failure to comply. A successful regulatory challenge to our performance under these fair lending laws and regulations could result in a wide variety of sanctions, including damages and civil money penalties. Such sanctions could have a material adverse effect on our business, financial condition and results of operations.
We are subject to certain risks associated with investing in real estate and real estate related assets, including risks of loss from adverse weather conditions, man-made or natural disasters, pandemics, terrorist attacks and the effects of climate change and, which may cause disruptions in our operations and could materially and adversely affect the real estate industry generally and our business, financial condition, liquidity and results of operations.
Weather conditions and man-made or natural disasters such as hurricanes, tornadoes, earthquakes, pandemics, floods, droughts, fires and other environmental conditions can adversely impact properties that we own or that collateralize loans we own or service, as well as properties where we conduct business. Future adverse weather conditions and man-made or natural disasters could also adversely impact the demand for, and value of, our assets, as well as the cost to service or manage such assets, directly impact the value of our assets through damage, destruction or loss, and thereafter materially impact the availability or cost of insurance to protect against these events. Terrorist attacks and other acts of violence may cause disruptions in U.S. financial markets and negatively impact the U.S. economy in general.
Potentially adverse consequences of global warming and climate change, including rising sea levels and increased intensity of extreme weather events, could similarly have an impact on our properties and the local economies of certain areas in which we operate. Although we believe the properties collateralizing our loan assets or underlying our MSR assets are appropriately covered by insurance, we cannot predict at this time if we or our borrowers will be able to obtain appropriate coverage at a reasonable cost in the future, or if we will be able to continue to pass along all of the costs of insurance. There also is a risk that one or more of our property insurers may not be able to fulfill their obligations with respect to claims payments due to a deterioration in its financial condition or may even cancel policies due to increasing costs of providing insurance coverage in certain geographic areas.
Certain types of losses, generally of a catastrophic nature, that result from events described above such as earthquakes, floods, hurricanes, tornados, terrorism, acts of war and pandemics, may also be uninsurable or not economically insurable. Inflation, changes in building codes and ordinances, environmental considerations and other factors, including terrorism or acts of war, also might make the insurance proceeds insufficient to repair or replace a property if it is damaged or destroyed. Under these circumstances, the insurance proceeds received might not be adequate to restore our economic position with respect to the affected real property. Any uninsured loss could result in the loss of cash flow from, and the asset value of, the affected property, which could have an adverse effect on our business, financial condition, liquidity and results of operations.
Risks Related to Regulatory Environment
Our mortgage loan origination and servicing activities are subject to a highly complex legal and regulatory framework, and non-compliance with or changes in laws and regulations governing our industry could harm our business, operating results, financial condition and prospects.
The mortgage industry is subject to a highly complex legal and regulatory framework. In addition to the licensing requirements for each of the jurisdictions in which we originate or service loans, we must comply with a number of federal, state and local consumer protection and other laws including, among others, the Truth in Lending Act, the RESP, the ECOA, the Fair Credit Reporting Act, the Fair Housing Act, the TCPA, the Gramm-Leach-Bliley Act, the Electronic Fund Transfer Act, the Servicemembers Civil Relief Act, the Military Lending Act, the Homeowners Protection Act, the Home Mortgage Disclosure Act, the SAFE Act, the Federal Trade Commission Act, the Dodd Frank Wall Street Reform and Consumer Protection Act of 2010 (“Dodd-Frank Act”), the CARES Act, federal, state and local laws designed to discourage predatory lending and servicing practices, prohibit unfair, deceptive, or abusive acts or practices, protect customer privacy, and regulate debt collection and consumer credit reporting, and state foreclosure laws. These and other laws and regulations directly affect our business and require constant compliance monitoring and internal and external audits and examinations by federal and state regulators. Changes to the laws, regulations and guidelines relating to the origination and servicing of mortgages, including those already adopted and those that may be adopted in response to the COVID-19 pandemic, their interpretation or the manner in which they are enforced could render our current business practices non-compliant or make compliance more difficult or expensive.
As a non-depository lending and servicing institution, we are subject to the regulatory authority of the CFPB, including, without limitation, its authority to conduct investigations, bring enforcement actions, impose monetary
17
penalties, require remediation of practices, pursue administrative proceedings or litigation, and obtain cease and desist orders for violations of applicable federal consumer financial laws. The CFPB has been active in investigations and enforcement actions and has issued civil money penalties to parties when the CFPB has determined that such parties have violated the laws and regulations it enforces. Our failure to comply with the federal consumer protection laws and regulations to which we are subject, whether that failure is actual or alleged, could expose us to enforcement actions or potential litigation liabilities.
It is possible that we are not, and will not in the future be, in full compliance with current and future laws and regulations, or interpretations of the foregoing. Our failure, or the failure of our loan officers, other employees, correspondent sellers or others with whom we have business relationships, to operate in compliance with any of the laws, regulations and guidelines relating to the origination, servicing and collection of mortgages could result in, among other things, the loss of licenses and approvals required for us to engage in the business of originating, servicing and collecting mortgage loans, governmental investigations and enforcement actions, damage to our brand and reputation, civil and criminal liability and administrative penalties, which could have a material and adverse effect on our business, operating results, financial condition and prospects.
The Financial Stability Oversight Council (“FSOC”) has recommended that federal and state regulators strengthen the prudential regulation of nonbank mortgage origination and servicing companies. The FSOC has also been conducting a review of the secondary-mortgage market focused on the regulation of Fannie Mae and Freddie Mac. Additionally, the Conference of State Bank Supervisors (“CSBS”) has issued a proposal for enhancing regulatory prudential standards for nonbank mortgage servicers subject to licensing and supervision by state financial regulators. The CSBS prudential regulatory proposal includes standards for capital, liquidity, risk management, data standards and integrity, data protection/ cyber risk, corporate governance, servicing transfer requirements, and change of control requirements. To the extent that the FSOC and other regulators move forward with new prudential reforms of nonbank mortgage originators or servicers (including designating nonbank mortgage companies for heightened prudential regulation by the Federal Reserve), the markets they serve, or the secondary-mortgage market, it could materially affect the operating costs, competitiveness, business plan, and prospects of our business.
We are subject to state licensing and operational requirements. Our failure to obtain and maintain the appropriate state licenses would prohibit us from originating or servicing mortgages in those states and adversely affect our operations.
Because we are not a federally chartered depository institution, we do not benefit from exemptions to state mortgage lending, loan servicing or debt collection licensing and regulatory requirements. In most states in which we operate, a regulatory agency or agencies regulates and enforces laws relating to mortgage servicing companies and mortgage origination companies such as us. These rules and regulations generally require that we seek and maintain certain licenses and comply with certain business practice standards, including requirements as to the form and content of contracts and other documentation and the licensing of our employees. As a non-bank mortgage lender, we are subject to licensure, regulation and supervision by every state and district in which we do business. States examine non-bank mortgage lenders and servicers periodically, depending on state law requirements and other factors such as the lender’s size and compliance history. These examinations may include a review of the non-bank lender’s compliance with all federal and state consumer protection laws, compliance management system and internal controls. Complying with this regulatory framework requires a meaningful dedication of management and financial resources. Changes to existing state legislation or the adoption of new state legislation, as well as our entry into new markets in states in which we had not previously operated, could increase our compliance costs. This could render business in any one state or states cost-prohibitive and could materially affect our business and our growth strategy. Any failure to comply with these licensing and operational requirements could have a material and adverse effect on our business, operating results, financial condition and prospects.
Changes in the guidelines of the GSEs, FHA, VA, USDA and Ginnie Mae could adversely affect our business.
We are required to follow specific guidelines and eligibility standards that impact the way we service and originate GSE and U.S. government agency loans, including guidelines and standards with respect to credit standards for mortgage loans, our staffing levels and other servicing practices and the servicing and ancillary fees that we may charge. In addition, we are required to meet certain minimum financial requirements relating to our net worth, capital ratio and liquidity in order to sell the loans that we originate to certain investors, including the GSEs. A change in these guidelines could require us to expend additional resources to originate and service mortgages or make it more difficult for us to do so profitably or at all and a failure to meet applicable financial requirements could materially impair our ability to originate and service loans, any of which could have a material and adverse effect on our business, operating results, financial condition and prospects.
In addition, changes in the nature or extent of the guarantees provided by Fannie Mae, Freddie Mac, Ginnie Mae, the USDA or the VA, or the insurance provided by the FHA, or coverage provided by private mortgage insurers, could also have broad adverse market implications. Any future increases in guarantee fees or changes to their structure or increases in the premiums we are required to pay to the FHA or private mortgage insurers for insurance or to the VA or the USDA for guarantees could increase mortgage origination costs and insurance premiums for our clients. These industry changes could result in reduced demand for our mortgage services, resulting in reduced origination volume and profitability for us, which could materially and adversely affect our business, operating results, financial condition and prospects.
Risks Related to Our Organization and Structure
We will be controlled by McCarthy Capital Mortgage Investors, LLC (“MCMI”), and MCMI’s interests may conflict with our interests and the interests of our other stockholders.
MCMI holds all of our issued and outstanding Class B common stock and controls approximately 95% of the combined voting power of our outstanding common stock. As a result, MCMI controls any action requiring the general approval of our stockholders, including the election of our Board of Directors, the adoption of amendments to our certificate of incorporation and bylaws and the approval of any merger or sale of substantially all of our
18
assets. So long as MCMI continues to directly or indirectly own a significant amount of our equity, even if such amount is less than a majority of the combined voting power of our outstanding common stock, MCMI will continue to be able to substantially influence the outcome of votes on all matters requiring approval by the stockholders. The interests of MCMI could conflict with or differ from our interests or the interests of our other stockholders. For example, the concentration of ownership held by MCMI could delay, defer or prevent a change of control of our Company or impede a merger, takeover or other business combination that may otherwise be attractive to us or our other stockholders.
We are a “controlled company” within the meaning of the NYSE rules and, as a result, we are permitted, and elect, to rely on exemptions from certain corporate governance requirements that provide protection to stockholders of other companies.
Because MCMI controls a majority of the combined voting power of our outstanding common stock, we are considered a controlled company under the applicable rules of the NYSE. As a controlled company, we are permitted to elect not to comply with certain corporate governance requirements of the NYSE, including the requirements that:
|
|
• |
a majority of our Board of Directors consist of independent directors; |
|
|
• |
we have a nominating and corporate governance committee that is composed entirely of independent directors; and |
|
|
• |
we have a compensation committee that is composed entirely of independent directors. |
These requirements will not apply to us as long as we remain a controlled company. Accordingly, investors in our Class A common stock may not have the same protections afforded to stockholders of companies that are subject to all of the corporate governance requirements of the NYSE.
Our directors and executive officers have significant control over our business.
Our directors and executive officers beneficially own, directly or indirectly, in the aggregate, approximately 36.5% of the outstanding shares of our Class A common stock and 100% of the outstanding shares of our Class B common stock (to the extent the Chairman of our Board of Directors may be deemed to beneficially own all of the shares of our Class B common stock beneficially owned by MCMI), representing an aggregate of approximately 97.1% of the combined voting power of our outstanding common stock. As a result, in addition to their day-to-day management roles, our executive officers and directors will be able to exercise significant influence on our business as stockholders, including influence over election of members of the Board of Directors and the authorization of other corporate actions requiring stockholder approval.
Risks Related to our Class A Common Stock
Sales of a substantial number of shares of our common stock by our existing stockholders in the public market could cause the price of our Class A common stock to fall.
Sales of a substantial number of shares of our common stock in the public market, or the perception that these sales might occur, could significantly reduce the market price of our Class A common stock. If our existing stockholders sell, or indicate an intention to sell, substantial amounts of our common stock (including shares of our Class B common stock that would convert to Class A common stock in connection with such sales) in the public market after the lock-up and legal restrictions on resale entered into in connection with our IPO expire, the trading price of our Class A common stock could substantially decline. Furthermore, if MCMI or our executive officers and directors were to sell a substantial portion of the shares they hold, it could cause our the price of our Class A common stock to decline.
Our issuance of capital stock in connection with financings, acquisitions, investments, our equity incentive plans or otherwise would dilute all other stockholders.
We may issue capital stock in the future. Any such issuance would result in dilution to all other stockholders. In the future, we may issue stock, including as a grant of equity awards to employees, directors and consultants under our equity incentive plans, to raise capital through equity financings or to acquire or make investments in companies, products or technologies for which we may issue equity securities as consideration or for financing purposes. Any such issuances of capital stock in the future may cause stockholders to experience significant dilution of their ownership interests and the per share value of our Class A common stock to decline.
We do not intend to pay dividends in the foreseeable future.
We do not anticipate declaring or paying regular cash dividends on our Class A common stock in the foreseeable future. Instead, we anticipate that most or all of our future earnings will be retained to support our operations and finance the growth and development of our business. Any future determination to declare and pay cash dividends, if any, will be made at the discretion of our Board of Directors and will depend on a variety of factors, including applicable laws, our financial condition, results of operations, contractual restrictions, capital requirements, business prospects, general business or financial market conditions, and other factors our Board of Directors may deem relevant. Investors should not purchase our Class A common stock with the expectation of receiving cash dividends.
Certain provisions in our certificate of incorporation and bylaws and of Delaware law may prevent or delay an acquisition of Guild, which could decrease the trading price of our Class A common stock.
Our certificate of incorporation, bylaws and Delaware law contain provisions that are intended to deter coercive takeover practices and inadequate takeover bids by making such practices or bids unacceptably expensive
19
to the bidder and to encourage prospective acquirers to negotiate with our Board of Directors rather than to attempt a hostile takeover. These provisions include, among others, those establishing:
|
|
• |
a dual class common stock structure, which provides MCMI with the ability to control the outcome of matters requiring stockholder approval, even if it beneficially owns significantly less than a majority of the shares of our outstanding common stock; |
|
|
• |
the division of our Board of Directors into three classes of directors, with each class serving a staggered three-year term, which could have the effect of making the replacement of incumbent directors more time-consuming and difficult; |
|
|
• |
the inability of our stockholders to call a special meeting; |
|
|
• |
the inability of our stockholders to act by written consent after MCMI and its affiliated private equity funds cease to beneficially own a majority of the combined voting power of our capital stock; |
|
|
• |
rules regarding how stockholders may present proposals or nominate directors for election at stockholder meetings; |
|
|
• |
the right of our Board of Directors to issue preferred stock without stockholder approval; |
|
|
• |
the inability of stockholders to remove directors without cause after MCMI, any other investment funds affiliated with MCMI, and any company or other entity controlled by, controlling or under common control with MCMI or any such investment fund (other than any portfolio company)cease to beneficially own a majority of the combined voting power of our capital stock; and |
|
|
• |
the ability of our directors, not our stockholders, to fill vacancies on the Board of Directors. |
In addition, because we have not elected to be exempt from Section 203 of the Delaware General Corporation Law (the “DGCL”), this provision could also delay or prevent a change of control that stockholders may favor. Section 203 of the DGCL provides that, subject to limited exceptions, a person that acquires, or is affiliated with a person that acquires, more than 15% of the outstanding voting stock of a Delaware corporation (an “interested stockholder”) must not engage in any business combination with that corporation, including by merger, consolidation or acquisitions of additional shares, for a three-year period following the date on which the person became an interested stockholder, unless (i) prior to such time, the board of directors of such corporation approved either the business combination or the transaction that resulted in the stockholder becoming an interested stockholder; (ii) upon consummation of the transaction that resulted in the stockholder becoming an interested stockholder, the interested stockholder owned at least 85% of the voting stock of such corporation at the time the transaction commenced (excluding for purposes of determining the voting stock outstanding (but not the outstanding voting stock owned by the interested stockholder) the voting stock owned by directors who are also officers or held in employee benefit plans in which the employees do not have a confidential right to tender or vote stock held by the plan); or (iii) on or subsequent to such time the business combination is approved by the board of directors of such corporation and authorized at a meeting of stockholders by the affirmative vote of at least two-thirds of the outstanding voting stock of such corporation not owned by the interested stockholder.
We believe these provisions protect our stockholders from coercive or otherwise unfair takeover tactics by requiring potential acquirers to negotiate with our Board of Directors and by providing our Board of Directors with more time to assess any acquisition proposal. These provisions are not intended to make Guild immune from takeovers. However, these provisions will apply even if the offer may be considered beneficial by some stockholders and could delay or prevent an acquisition that our Board of Directors determines is not in the best interests of Guild and its stockholders. These provisions may also prevent or discourage attempts to remove and replace incumbent directors.
Our Board of Directors has the ability to issue blank check preferred stock, which may discourage or impede acquisition attempts or other transactions.
Our Board of Directors has the power, subject to applicable law, to issue series of preferred stock that could, depending on the terms of the series, impede the completion of a merger, tender offer or other takeover attempt. For instance, subject to applicable law, a series of preferred stock may impede a business combination by including class voting rights, which would enable the holder or holders of such series to block a proposed transaction. Our Board of Directors will make any determination to issue shares of preferred stock based on its judgment as to our and our stockholders’ best interests. Our Board of Directors, in so acting, could issue shares of preferred stock having terms which could discourage an acquisition attempt or other transaction that some, or a majority, of the stockholders may believe to be in their best interests or in which stockholders would have received a premium for their stock over the then-prevailing market price of the stock.
Our certificate of incorporation contains an exclusive forum provision that may discourage lawsuits against us and our directors and officers.
Our certificate of incorporation provides that, unless the Board of Directors otherwise determines, the state courts in the State of Delaware or, if no state court located within the State of Delaware has jurisdiction, the federal court for the District of Delaware, will be the sole and exclusive forum for any derivative action or proceeding brought on behalf of Guild, any action asserting a claim of breach of a fiduciary duty owed by any director or officer of Guild to Guild or Guild’s stockholders, any action asserting a claim against Guild or any director or officer of Guild arising pursuant to any provision of the DGCL or Guild’s certificate of incorporation or bylaws, or any action asserting a claim against Guild or any director or officer of Guild governed by the internal affairs doctrine under Delaware law (collectively, the “covered actions”). This exclusive forum provision applies to all covered actions, including any covered action in which the plaintiff chooses to assert a claim or claims under federal law in addition to a claim or claims under Delaware law, although stockholders will not be deemed to have waived our compliance with the federal securities laws and the rules and regulations thereunder. This exclusive forum provision does not
20
apply to actions that do not assert any covered Delaware state law claims, such as, for example, any action asserting solely federal securities law claims, and the enforceability of similar choice of forum provisions in other companies’ organizational documents has been challenged in legal proceedings and it is possible that, in connection with claims arising under federal securities laws or otherwise, a court could find this exclusive forum provision to be inapplicable or unenforceable.
This exclusive forum provision may limit the ability of Guild’s stockholders to bring a claim in a judicial forum that such stockholders find favorable for disputes with Guild or Guild’s directors or officers, which may discourage such lawsuits against Guild and Guild’s directors and officers. Alternatively, if a court were to find this exclusive forum provision inapplicable to, or unenforceable in respect of, one or more of the specified types of actions or proceedings described above, Guild may incur additional costs associated with resolving such matters in other jurisdictions or forums, which could materially and adversely affect Guild’s business, financial condition or results of operations.
The dual class structure of our common stock may adversely affect the trading market for our Class A common stock.
We cannot predict the potential effects our dual class structure may have on our Class A common stock, such as a lower or more volatile market price. In 2017, S&P Dow Jones and FTSE Russell announced that they would begin excluding most newly public companies with multiple classes of shares of common stock from being added to certain indices, including the Russell 2000, the S&P 500, the S&P MidCap 400 and the S&P SmallCap 600. As a result, our dual class capital structure would make us ineligible for inclusion in any of these indices, and mutual funds, exchange-traded funds and other investment vehicles that attempt to passively track these indices likely will not invest in our stock. Furthermore, we cannot assure you that other stock indices will not take a similar approach to S&P Dow Jones or FTSE Russell in the future. It is unclear what effect, if any, these policies will have on the valuations of publicly traded companies excluded from these indices. Given the sustained flow of investment funds into passive strategies that seek to track certain indices, however, it is possible that exclusion from such indices could make our Class A common stock less attractive to investors. As a result, the market price of our Class A common stock could be adversely affected.
ITEM 1B. UNRESOLVED STAFF COMMENTS
Not applicable.
ITEM 2. PROPERTIES
Our principal executive office is located in San Diego, California. In addition to our San Diego office, we operate from approximately 200 branch offices and 124 satellite offices located in 32 states. We lease our principal executive office and each of our branch and satellite offices. The square footage of our principal executive office is 141,696 square feet and the average square footage of our branch and satellite offices is approximately 3,800 square feet and approximately 1,750 square feet, respectively.
ITEM 3. LEGAL PROCEEDINGS
We are, and from time to time may become, involved in legal and regulatory proceedings or subject to claims arising in the ordinary course of our business. We operate within highly regulated industries on a federal, state and local level and are routinely subject to various examinations and legal and regulatory proceedings in the normal and ordinary course of business. We are not presently a party to any legal or regulatory proceedings that in the opinion of our management, if determined adversely to us, would individually or taken together have a material adverse effect on our business, results of operations and financial condition.
ITEM 4. MINE SAFETY DISCLOSURES
Not Applicable.
21
part II
ITEM 5. MARKET FOR REGISTRANT’S COMMON EQUITY, RELATED STOCKHOLDER MATTERS AND ISSUER PURCHASES OF EQUITY SECURITIES
Market Information
The Company has two classes of common stock: Class A and Class B. Class A common stock is traded on the New York Stock Exchange under the symbol “GHLD.” There is no public market for the Company’s Class B common stock. However, under the terms of the Company’s Certificate of Incorporation, the holder of Class B common stock may convert any portion or all of the holder’s shares of Class B common stock into an equal number of shares of Class A common stock at any time.
Holders of Record
As of March 12, 2021, there were 19,666,981 issued and outstanding shares of our Class A common stock held by 21 stockholders of record, and there were 40,333,019 issued and outstanding shares of our Class B common stock held by one stockholder of record. The number of record holders was determined from the records of our transfer agent and does not include beneficial owners of shares of Common Stock whose shares are held in the names of various security brokers, dealers, and registered clearing agencies.
Dividends
We have not paid any cash dividends on our Common Stock to date and do not intend to pay cash dividends. The payment of cash dividends in the future will be dependent upon our revenues and earnings, if any, capital requirements and general financial condition. The payment of any cash dividends will be within the discretion of our Board of Directors at such time. Further, our ability to declare dividends may be limited by restrictive covenants in connection with our indebtedness.
Securities Authorized for Issuance Under Equity Compensation Plans
In October 2020, the Board of Directors adopted, and our then-current shareholders approved, our 2020 Omnibus Incentive Plan (the “2020 Plan”).
|
|
|
Equity Compensation Plan Information |
|
|||||||||
|
Plan category |
|
Number of securities to be issued upon exercise of outstanding options, warrants and rights (a) |
|
|
Weighted- average exercise price of outstanding options, warrants and rights (b) |
|
|
Number of securities remaining available for future issuance under equity compensation plans (excluding securities reflected in column (a)) (c) |
|
|||
|
Equity compensation plans approved by security holders |
|
|
1,440,334 |
|
|
$ |
— |
|
|
|
4,059,666 |
|
|
Equity compensation plans not approved by security holders |
|
|
— |
|
|
|
— |
|
|
|
— |
|
|
Total |
|
|
1,440,334 |
|
|
$ |
— |
|
|
|
4,059,666 |
|
Recent Sales of Unregistered Securities
We did not have any sales of unregistered equity securities during the three months ended December 31, 2020.
Use of Proceeds
None.
Purchases of Equity Securities by the Issuer and Affiliated Purchasers
None.
ITEM 6. [RESERVED]
22
ITEM 7. MANAGEMENT’S DISCUSSION AND ANALYSIS OF FINANCIAL CONDITION AND RESULTS OF OPERATIONS
MANAGEMENT’S DISCUSSION AND ANALYSIS OF
FINANCIAL CONDITION AND RESULTS OF OPERATIONS
The following Management’s Discussion and Analysis of Financial Condition and Results of Operations is intended to highlight and supplement data and information presented elsewhere in this Annual Report, including the consolidated financial statements and related notes thereto included in Item 8. The following discussion includes forward-looking statements that reflect our plans, estimates and assumptions and involve numerous risks and uncertainties, including, but not limited to, those described in the “Risk Factors” section of this Annual Report. See also “Cautionary Note Regarding Forward-Looking Statements.” Future results could differ significantly from the historical results presented in this section.
Business and Executive Overview
We started our business in 1960 and are among the longest-operating seller servicers in the United States. We are a growth-oriented mortgage company that employs a relationship-based loan sourcing strategy to execute our mission of delivering the promise of home ownership in neighborhoods and communities across the United States. Our business model is centered on providing a personalized mortgage-borrowing experience that is delivered by our knowledgeable loan officers and supported by our diverse product offerings. Throughout these individualized interactions, we work to earn our clients’ trust and confidence as a financial partner that can help them find their way through life’s changes and build for the future. Through steady organic growth and a series of targeted acquisitions, we grew our annual origination volume from $1.4 billion for the year ended December 31, 2007 to $35.3 billion for the year ended December 31, 2020 and grew our servicing portfolio from $2.5 billion of UPB as of December 31, 2007 to $60.0 billion of UPB as of December 31, 2020. Unless otherwise indicated, the UPB of our servicing portfolio excludes any subserviced loans. The historical information below is provided to show compounded annual growth since 2007, when Guild Mortgage Company was purchased from its founder by a management-led partnership that included a majority investment from MCMI.
Guild’s Annual Origination Volume and Market Share
Source: Inside Mortgage Finance Publications, Inc. Copyright © 2020. Used with permission.
|
(1) |
CAGR is equal to the compound annual growth rate of Guild’s annual origination volume for the year ended December 31, 2007 through the year ended December 31, 2020. |
23
Servicing Portfolio Growth
(UPB as of period end)(1)
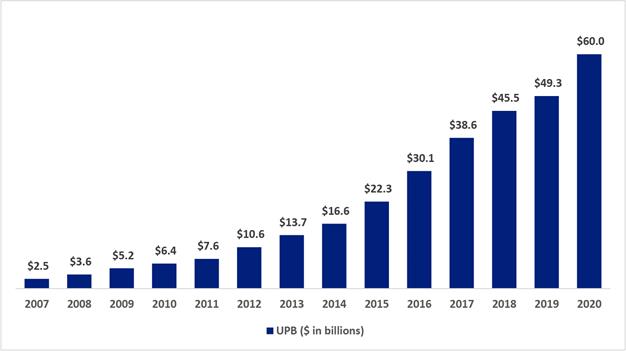
|
(1) |
Excludes subservicing portfolio of $844.6 million as of December 31, 2020. |
Executive Summary of Results of Operations for Periods Presented
Year Ended December 31, 2020 Summary
For the year ended December 31, 2020, we originated $35.3 billion of mortgage loans compared to $21.8 billion for the year ended December 31, 2019, representing an increase of $13.5 billion or 61.4%. This increase was primarily due to decreased interest rates, which led to an increase in origination volume across the U.S. mortgage market. Our servicing portfolio as of December 31, 2020 was $60.0 billion of UPB compared to $49.3 billion of UPB as of December 31, 2019, with the average size of the portfolio increasing 15.3% over that time. We generated $370.6 million of net income for the year ended December 31, 2020 compared to $5.6 million for the year ended December 31, 2019. We generated $523.8 million of Adjusted Net Income for the year ended December 31, 2020 compared to $139.1 million for the year ended December 31, 2019, representing a 276.6% increase, and we generated $714.3 million of Adjusted EBITDA for the year ended December 31, 2020 compared to $201.5 million for the year ended December 31, 2019, representing a 254.5% increase. Please see “—Non-GAAP Financial Measures” for further information regarding our use of Adjusted Net Income and Adjusted EBITDA, including limitations related to such non-GAAP measures and a reconciliation of such measures to net income, the nearest comparable financial measure calculated and presented in accordance with accounting principles generally accepted in the United States of America (“GAAP”).
The above-described increase in Adjusted Net Income and Adjusted EBITDA was primarily due to the increase in loan origination fees and gain on sale of loans, net of $939.1 million for the year ended December 31, 2020 compared to the year ended December 31, 2019. The increase in loan origination fees and gain on sale of loans, net was driven by the increase in origination volume described above, as well as an increase in gain on sale margins on originated loans, which increased 122 basis points or 32.3% for the year ended December 31, 2020 compared to the year ended December 31, 2019. This increase in gain on sale margins was primarily due to an increase in the secondary marketing spread because of market volatility and low interest rates, which caused industry capacity constraints. Our increased origination volume also resulted in an increase in variable salaries, incentive compensation and benefits expense of $375.6 million or 65.0% for the year ended December 31, 2020 compared to the year ended December 31, 2019.
Net Income includes a loss of $296.3 million due to a decrease in the fair value of our MSRs resulting from a decrease in projected duration of cash flow collections during the period. Comparatively, for the year ended December 31, 2019, we recognized a loss of $255.2 million due to a decrease in the fair value of MSRs. According to the Mortgage Finance Forecast from the Mortgage Bankers Association (the “MBA Mortgage Finance Forecast”), average 30-year mortgage rates declined by 90 basis points from December 31, 2019 to December 31, 2020. A decline of this nature generally results in higher prepayment speeds and a subsequent downward adjustment to the fair value of our MSRs for the loans that still exist in our portfolio. However, when rates decline, our origination volume generally increases as refinance opportunities increase.
Management believes that maintaining both an origination segment and a servicing segment provides us with a more balanced business model in both rising and declining interest rate environments, compared to other industry participants that predominately focus on either origination or servicing, instead of both. In addition, one of our business strategies is to seek to recapture mortgage transactions when our borrowers prepay their loans. During the year ended December 31, 2020, we had a 26% purchase recapture rate, a 66% refinance recapture rate and a 60% overall recapture rate, compared to 26%, 64% and 56%, respectively, for the year ended December 31, 2019. Purchase recapture is calculated based on those clients who originate a new mortgage for the purchase of a home, and refinance recapture is calculated based on those clients who originate a new mortgage to refinance an existing mortgage. Overall recapture rate is calculated as the total UPB of our clients that originated a new mortgage with us
24
in a given period, divided by the total UPB of our clients that paid off their existing mortgage and originated a new mortgage in the same period. This calculation excludes clients to whom we did not actively market due to contractual prohibitions or other business reasons.
Recent Developments
COVID-19 Pandemic
Business Operations and Liquidity
We continue to closely monitor the economic impact resulting from the COVID-19 pandemic. Although we experienced record origination volume and increased profit margins in our origination segment during the year ended December 31, 2020, the COVID-19 pandemic has had a slight negative impact on the financial results of our servicing segment. The federal government enacted the CARES Act, which allowed borrowers with federally backed loans to request a temporary mortgage forbearance. In February 2021, the Federal Housing Finance Agency, the Department of Housing and Urban Development, the Department of Veterans Affairs, and the Department of Agriculture announced an extension of the forbearance period of three to six months depending on the loan type. As a result of the CARES Act forbearance requirements and the subsequent extension of federal forbearance programs, we have recorded and expect to record additional increases in delinquencies in our servicing portfolio. As of December 31, 2020, the 60-plus day delinquency rate on our servicing portfolio was 3.5%, compared to a 60-plus day delinquency rate of 1.6% as of December 31, 2019. The 60-plus day delinquency rate in the U.S. mortgage market as of December 31, 2020 was 5.0%, according to the Mortgage Bankers Association. This increased delinquency rate on our servicing portfolio may require us to finance substantial amounts of advances of principal and interest, property taxes, insurance premiums and other expenses to protect investors’ interests in the properties securing the loans. We have increased our provision for foreclosure losses due to this increased delinquency rate, as described further below. These advances and payments, coupled with increased servicing costs and lower servicing revenue, have negatively affected and will continue to negatively affect our cash position. We continuously monitor the requirements around these advances and how, if at all, they impact our liquidity. Additionally, we are currently prohibited from collecting certain servicing-related fees, such as late fees, and initiating foreclosure proceedings. As a result, we expect the effects of the CARES Act forbearance requirements and the subsequent federal forbearance programs to reduce our servicing income and increase our servicing expenses.
As of February 28, 2021, approximately 3.2% of the loans in our servicing portfolio had elected the forbearance option compared to the industry average of 5.2%, as reported by the Mortgage Bankers Association and, as of December 31, 2020, approximately 3.5% of the loans in our servicing portfolio had elected the forbearance option compared to the industry average of 5.5%, as reported by the Mortgage Bankers Association. Of the 3.2% of the loans in our servicing portfolio that had elected forbearance as of February 28, 2021, approximately 8.0% remained current on their February payments and, of the 3.5% of the loans in our servicing portfolio that had elected forbearance as of December 31, 2020, approximately 10.9% remained current on their December payments. We believe our portfolio has performed better than the industry average because of our in-house servicing capabilities and timely response to the COVID-19 pandemic and that our performance is a testament to the strength of our client relationships. Our in-house servicing team and local loan officers continue to work with our clients to understand forbearance plans and determine the best paths forward for their unique circumstances. By maintaining relationships with our clients throughout the loan lifecycle, and supporting our clients during times of uncertainty, we position ourselves to capture future business.
Servicing Portfolio Forbearance
(as of period end)
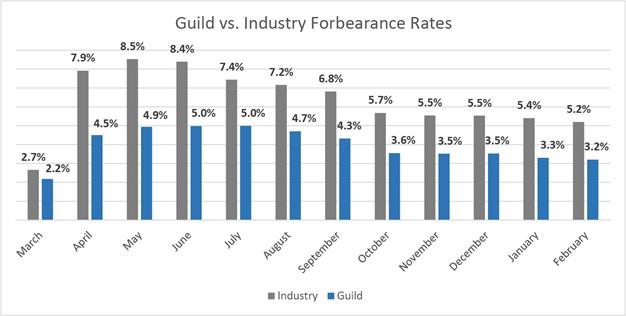
Source: Mortgage Bankers Association.
Increased Liquidity
During 2020, to support our increased loan origination volume, we increased the capacity of our existing loan funding facilities by $905.0 million, of which $180.0 million represented a temporary increase in capacity. We
25
added one additional loan funding facility during the second quarter of 2020 with a total facility size of $100.0 million, for which we subsequently increased the capacity by $100.0 million during the third quarter of 2020. As of December 31, 2020, the aggregate available amount under our loan facilities was approximately $3.0 billion. In January 2021, we added one additional loan funding facility with a total facility size of $250.0 million.
During 2020, we renewed two of our MSR notes payable and increased the aggregate committed amounts under those MSR notes payable by $42.0 million. See “—Liquidity, Capital Resources and Cash Flows” for further information regarding our funding facilities.
The extent to which the COVID-19 pandemic affects our business, results of operations and financial condition will ultimately depend on future developments, which are highly uncertain and cannot be predicted, including the scope and duration of the pandemic and actions taken by governmental authorities and other third parties in response to the pandemic. See “Risk Factors—The COVID-19 pandemic has had, and will likely continue to have, an adverse effect on our business, and its ultimate effect on our business and financial results will depend on future developments, which are highly uncertain and cannot be predicted, including the scope and duration of the pandemic and actions taken or to be taken by government authorities in response to the pandemic.”
Description of Certain Components of Financial Data
The primary components of our revenue and expenses are described below.
Our Components of Revenue
Loan origination fees and gain on sale of loans, net — This represents all income recognized from the time when a loan is originated until the time when a loan is subsequently sold to an investor and includes cash and non-cash components. Each component is described below:
|
|
• |
Gain (loss) on sale of loans — Net proceeds from the difference between the quoted loan price committed to the client and the price received from the investor at loan sale, net of miscellaneous investor fees charged. |
|
|
• |
Loan origination fees — Fees collected from the client, which typically include processing, underwriting, funding, credit report, tax service, flood certification and appraisal fees, net of any associated third-party costs. |
|
|
• |
The fair value of the MSRs at time of sale — After a loan for which we continue to act as the servicer is sold to an investor, we record the value of the MSR at fair value. Fair value is estimated based on the present value of future cash flows. We utilize a third-party valuation service to determine this estimated value based on variables such as contractual servicing fees, ancillary fees, estimated prepayment speeds, discount rate and the cost to service. |
|
|
• |
Changes in the fair value of IRLC and MLHS — When the client accepts an interest rate lock, we record the estimated fair value of the loan. We also evaluate several factors to determine the likelihood of the loan closing and discount the value of any interest rate lock commitments (“IRLCs”) we consider having a lower probability of closing. The probability of the loan ultimately closing changes as the stage of the loan progresses from application to underwriting submission, loan approval and funding. Loans that close and are held for sale are commonly referred to as mortgage loans held for sale or “MLHS.” MLHS are also recorded at fair value. We typically determine the fair value of our MLHS based on investor committed pricing; however, we determine the fair value of any MLHS that is not allocated to a commitment based on current delivery trade prices. |
|
|
• |
Changes in the fair value of forward delivery commitments — We enter into forward delivery commitments to hedge against changes in the interest rates associated with our IRLCs and MLHS. Our hedging policies are set by our risk management function and are monitored daily. Typically, when the fair value of an IRLC or MLHS increases, the fair value of any related forward contract decreases. |
|
|
• |
Provision for investor reserves — At the time a loan is sold to an investor, we make certain representations and warranties. If defects are subsequently discovered in these representations and warranties that cause a loan to no longer satisfy the applicable investor eligibility requirements, we may be required to repurchase that loan. We are also required to indemnify several of our investors for borrowers’ prepayments and defaults. We estimate the potential for these losses based on our recent and historical loan repurchase and indemnification experience and our success rate on appeals. We also screen market conditions for any indications of a rise in delinquency rates, which may result in a heightened exposure to loss. |
|
|
• |
Early pay-off fees – The amount of gain on sale premium received from the investors who purchase our loans that we must return to those investors when loans sold to them are repaid before a specified point in time. |
Loan servicing and other fees — Loan servicing and other fees consist of:
|
|
• |
Loan servicing income — This represents the contractual fees that we earn by servicing loans for various investors. Fees are calculated based on a percentage of the outstanding principal balance and are recognized into revenue as related payments are received. |
|
|
• |
Other ancillary fees — We may also collect other ancillary fees from the client, such as late fees and nonsufficient funds fees. |
|
|
• |
Impound interest — We are required to pay interest to our clients annually based on the average escrow account balances that we hold in trust for the payment of their property taxes and insurance. |
26
Valuation adjustment of mortgage servicing rights — We have elected to recognize MSRs at fair value. This requires that we periodically reevaluate the valuation of our MSRs following our initial analysis at the time of sale. A third party conducts a monthly valuation of our MSRs, and we record any changes to the fair value of our MSRs that result from changes in valuation model inputs or assumptions and collections of servicing cash flows in accordance with such third-party analysis. Changes in the fair value of our MSRs result in an adjustment to the value of our MSRs. See “Critical Accounting Policies—Mortgage Servicing Rights” for additional information regarding the valuation of our MSRs.
Interest income — Interest income consists primarily of interest earned on MLHS.
Interest expense — Interest expense consists primarily of interest paid on funding and non-funding debt facilities collateralized by our MLHS and MSRs. We define funding debt as all other debt related to operations, such as warehouse lines of credit and our early buyout facility, which we use to repurchase certain delinquent GNMA loans. Non-funding debt includes the note agreements collateralized by our MSRs (our “MSR notes payable”). We also record related bank charges and payoff interest expense as interest expense. Payoff interest expense is equal to the difference between what we collect in interest from our clients and what we remit in interest to the investors who purchase the loans that we originate. For loans sold through Agency MBS, we are required to remit a full month of interest to those investors, regardless of the date on which the client prepays during the payoff month, resulting in additional interest expense.
Other income, net — Other income, net typically includes dividend and fair value adjustments related to marketable securities that are generally immaterial to our operating results.
Our Components of Expenses
Salaries, incentive compensation and benefits — Salaries, incentive compensation and benefits expense includes all payroll, incentive compensation and employee benefits paid to our employees, as well as expenses incurred in connection with our use of employment and temporary help agencies. Our loan officers are paid incentive compensation based on origination volume, resulting in a variable pay structure that fluctuates.
General and administrative — General and administrative expense primarily includes costs associated with professional services, attendance at conferences and meetings, office expenses, liability insurance, business licenses and other miscellaneous costs.
In addition, within general and administrative expense, we record any adjustments to the fair value of the contingent liabilities related to our completed acquisitions, commonly known as “earn-out payments.” These payments are estimated based on the present value of future cash flows during the earn-out period. The earn-out periods for our acquisitions span from three to five years, and the earn-out periods for two of our acquisitions are still ongoing.
Occupancy, equipment and communication — Occupancy, equipment and communication includes expenses related to the commercial office spaces we lease, as well as telephone and internet service and miscellaneous leased equipment used for operations.
Depreciation and amortization — We depreciate furniture and equipment on a straight-line basis for a period of up to five years and we record amortization expense related to our leasehold improvements on rented space. That amortization expense is recognized over the shorter of the lease term or the useful life of the asset. We also record costs related to the maintenance of software, which consist of both internal and external costs incurred in connection with software development and testing, as well as any costs associated with the implementation of new software. These costs are amortized over a three-year period.
Provision for foreclosure losses — We may incur a loss on government loans related to unreimbursed interest and costs associated with foreclosure. We reserve for government loans based on historical loss experience as well as for loan-specific issues related to foreclosure.
Income tax expense — We are subject to federal and state income tax. We record this expense based on our statutory federal and state tax rates. These statutory rates are adjusted for permanent non-deductible differences and reconciliation differences from prior years. We also evaluate material temporary differences to determine whether any additional adjustments to this expense are required.
Future Public Company Expenses
In connection with our having become and being a public company, we expect our expenses to increase, including, but not limited to, our legal, accounting and insurance expenses. Although we do not anticipate any increase in these expenses to have a material effect on our overall results of operations, our historical results of operations may not be indicative of our future results of operations. If we fail to manage these additional costs or to maintain or increase our revenue, we may incur losses in the future.
27
Key Performance Indicators
Management reviews several key performance indicators to evaluate our business results, measure our performance and identify trends to inform our business decisions. Summary data for these key performance indicators is listed below. Please refer to “Results of Operations” for additional metrics that management reviews in conjunction with the consolidated financial statements.
|
|
|
Year Ended December 31, |
|
|
|
|
|
|
|
|
|
|||||
|
($ and units in thousands) |
|
2020 |
|
|
2019 |
|
|
Change |
|
|
% Change |
|
||||
|
Origination Data |
|
|
|
|
|
|
|
|
|
|
|
|
|
|
|
|
|
$ Total in-house origination(1) |
|
$ |
35,185,528 |
|
|
$ |
21,711,668 |
|
|
$ |
13,473,860 |
|
|
|
62.1 |
% |
|
# Total in-house origination |
|
|
125 |
|
|
|
81 |
|
|
|
44 |
|
|
|
54.3 |
% |
|
$ Retail in-house origination |
|
$ |
34,277,631 |
|
|
$ |
20,938,310 |
|
|
$ |
13,339,321 |
|
|
|
63.7 |
% |
|
# Retail in-house origination |
|
|
121 |
|
|
|
77 |
|
|
|
44 |
|
|
|
57.1 |
% |
|
$ Retail brokered origination(2) |
|
$ |
80,368 |
|
|
$ |
136,106 |
|
|
$ |
(55,738 |
) |
|
|
(41.0 |
)% |
|
Total originations |
|
$ |
35,265,896 |
|
|
$ |
21,847,774 |
|
|
$ |
13,418,122 |
|
|
|
61.4 |
% |
|
Gain-on-sale margin (bps)(3) |
|
|
500 |
|
|
|
378 |
|
|
|
122 |
|
|
|
32.3 |
% |
|
30-year conventional conforming par rate(4) |
|
|
2.8 |
% |
|
|
3.7 |
% |
|
|
(0.9 |
)% |
|
|
(24.3 |
)% |
|
Servicing Data |
|
|
|
|
|
|
|
|
|
|
|
|
|
|
|
|
|
UPB (period end)(5) |
|
$ |
59,969,653 |
|
|
$ |
49,326,579 |
|
|
$ |
10,643,074 |
|
|
|
21.6 |
% |
|
Loans serviced (period end) |
|
|
271 |
|
|
|
237 |
|
|
|
34 |
|
|
|
14.3 |
% |
|
MSR multiple (period end)(6) |
|
|
2.7 |
|
|
|
2.9 |
|
|
|
(0.2 |
) |
|
|
(6.9 |
)% |
|
Weighted average coupon rate |
|
|
3.6 |
% |
|
|
4.2 |
% |
|
|
(0.6 |
)% |
|
|
(14.3 |
)% |
|
Loan payoffs(7) |
|
$ |
19,605,379 |
|
|
$ |
9,374,095 |
|
|
$ |
10,231,284 |
|
|
|
109.1 |
% |
|
Loan delinquency rate 60-plus days (period end) |
|
|
3.5 |
% |
|
|
1.6 |
% |
|
|
1.9 |
% |
|
|
118.8 |
% |
|
(1) |
Includes retail and correspondent loans and excludes brokered loans. |
|
(2) |
Brokered loans are defined as loans we originate in the retail channel that are processed by us but underwritten and closed by another lender. These loans are typically for products we choose not to offer in-house. |
|
(3) |
Represents the components of loan origination fees and gain on sale of loans, net described under “—Our Components of Revenue” divided by total in-house origination to derive basis points. Our gain-on-sale margin based on pull-through adjusted lock volume was 449 basis points and 359 basis points for the years ended December 31, 2020 and December 31, 2019, respectively. Gain-on-sale margin based on pull-through adjusted lock volume represents the components of loan origination fees and gain on sales of loans, net described under “—Our Components of Revenue” divided by pull-through adjusted lock volume. Pull-through adjusted lock volume is equal to total locked volume multiplied by pull-through rates of 87.8% and 89.4% for the years ended December 31, 2020 and December 31, 2019, respectively. We estimate the pull-through rate based on changes in pricing and actual borrower behavior using a historical analysis of loan closing data and “fallout” data with respect to the number of commitments that have historically remained unexercised. For additional information regarding our total locked volume and pull-through adjusted lock volume for the years ended December 31, 2020 and December 31, 2019, see “—Results of Operations for the Years Ended December 31, 2020 and 2019—Revenue—Loan Origination Fees and Gain on Sale of Loans, Net.” |
|
(4) |
Represents the 30-year average conventional conforming note rate published monthly according to the MBA Mortgage Monthly Finance Forecast. |
|
(5) |
Excludes subserviced portfolio of $844.6 million and $1.3 billion as of December 31, 2020 and December 31, 2019, respectively. |
|
(6) |
Represents a metric used to determine the relative value of our MSRs in relation to our annualized retained servicing fee. It is calculated by dividing (a) the fair market value of our MSRs as of a specified date by (b) the weighted average annualized retained servicing fee for our servicing portfolio as of such date. We exclude purchased MSRs from this calculation because our servicing portfolio consists primarily of originated MSRs and, consequently, purchased MSRs do not have a material impact on our weighted average service fee. |
|
(7) |
Represents the gross amount of UPB paid off from our servicing portfolio. |
Non-GAAP Financial Measures
To supplement our financial statements presented in accordance with GAAP and to provide investors with additional information regarding our GAAP financial results, we have presented in this Annual Report Adjusted Net Income, Adjusted EBITDA and Adjusted Return on Equity, which are non-GAAP financial measures. These non-GAAP financial measures are not based on any standardized methodology prescribed by GAAP and are not necessarily comparable to similarly titled measures presented by other companies.
Adjusted Net Income. We define Adjusted Net Income as earnings before the change in the fair value measurements related to our MSRs, contingent liabilities related to completed acquisitions due to changes in valuation assumptions and stock-based compensation. The fair value of our MSRs is estimated based on a projection of expected future cash flows and the fair value of our contingent liabilities related to completed acquisitions is estimated based on a projection of expected future earn-out payments. Adjusted Net Income is also adjusted by applying an implied tax effect to these adjustments. The Company excludes the change in the fair value of its MSRs due to changes in model inputs and assumptions from Adjusted Net Income and Adjusted EBITDA because the Company believes this non-cash, non-realized adjustment to total revenues is not indicative of the Company’s operating performance or results of operation but rather reflects changes in model inputs and assumptions (e.g., prepayment speed, discount rate and cost to service assumptions) that impact the carrying value of the Company’s MSRs from period to period.
28
Adjusted EBITDA. We define Adjusted EBITDA as earnings before interest (without adjustment for net warehouse interest related to loan fundings and payoff interest related to loan prepayments), taxes, depreciation and amortization exclusive of any change in the fair value measurements of the MSRs due to valuation assumptions, contingent liabilities from business acquisitions and stock-based compensation. The Company excludes the change in the fair value of its MSRs due to changes in model inputs and assumptions from Adjusted Net Income and Adjusted EBITDA because the Company believes this non-cash, non-realized adjustment to total revenues is not indicative of the Company’s operating performance or results of operation but rather reflects changes in model inputs and assumptions (e.g., prepayment speed, discount rate and cost to service assumptions) that impact the carrying value of the Company’s MSRs from period to period.
Adjusted Return on Equity. We define Adjusted Return on Equity as Adjusted Net Income as a percentage of average beginning and ending stockholders’ equity during the period. For periods of less than one year, Adjusted Return on Equity is shown on an annualized basis.
We use these non-GAAP financial measures to evaluate our operating performance, to establish budgets and to develop operational goals for managing our business. These non-GAAP financial measures are designed to evaluate operating results exclusive of fair value adjustments that are not indicative of management’s operating performance. Accordingly, we believe that these financial measures provide useful information to investors and others in understanding and evaluating our operating results, enhancing the overall understanding of our past performance and future prospects.
Our non-GAAP financial measures are not prepared in accordance with GAAP and should not be considered in isolation of, or as an alternative to, measures prepared in accordance with GAAP. There are a number of limitations related to the use of these non-GAAP financial measures rather than net income (loss), which is the most directly comparable financial measure calculated and presented in accordance with GAAP for Adjusted Net Income and Adjusted EBITDA, and return on equity, which is the most directly comparable financial measure calculated and presented in accordance with GAAP for Adjusted Return on Equity. These limitations include that these non-GAAP financial measures are not based on a comprehensive set of accounting rules or principles and many of the adjustments to the GAAP financial measures reflect the exclusion of items that are recurring and may be reflected in the Company’s financial results for the foreseeable future. In addition, other companies may use other measures to evaluate their performance, all of which could reduce the usefulness of our non-GAAP financial measures as tools for comparison.
The following tables reconcile Adjusted Net Income and Adjusted EBITDA to net income (loss) and Adjusted Return on Equity to return on equity, the most directly comparable financial measures calculated and presented in accordance with GAAP.
|
Reconciliation of Net Income to Adjusted Net Income |
|
Years ended December 31, |
|
|||||
|
($ in thousands) |
|
2020 |
|
|
2019 |
|
||
|
Net income |
|
$ |
370,577 |
|
|
$ |
5,577 |
|
|
Add adjustments: |
|
|
|
|
|
|
|
|
|
Change in fair value of MSRs due to model inputs and assumptions |
|
|
171,565 |
|
|
|
171,398 |
|
|
Change in fair value of contingent liabilities due to acquisitions |
|
|
31,705 |
|
|
|
7,920 |
|
|
Stock-based compensation |
|
|
1,045 |
|
|
|
— |
|
|
Tax impact of adjustments(1) |
|
|
(51,079 |
) |
|
|
(45,816 |
) |
|
Adjusted Net Income |
|
$ |
523,813 |
|
|
$ |
139,079 |
|
|
(1) |
Implied tax rate used is 25.0% and 25.5% for the years ended December 31, 2020 and 2019, respectively. |
|
Reconciliation of Net Income to Adjusted EBITDA |
|
Years ended December 31, |
|
|||||
|
($ in thousands) |
|
2020 |
|
|
2019 |
|
||
|
Net income |
|
$ |
370,577 |
|
|
$ |
5,577 |
|
|
Add adjustments: |
|
|
|
|
|
|
|
|
|
Interest expense on non-funding debt |
|
|
8,417 |
|
|
|
8,980 |
|
|
Income tax expense |
|
|
123,493 |
|
|
|
253 |
|
|
Depreciation and amortization |
|
|
7,501 |
|
|
|
7,333 |
|
|
Change in fair value of MSRs due to model inputs and assumptions |
|
|
171,565 |
|
|
|
171,398 |
|
|
Change in fair value of contingent liabilities due to acquisitions |
|
|
31,705 |
|
|
|
7,920 |
|
|
Stock-based compensation |
|
|
1,045 |
|
|
|
— |
|
|
Adjusted EBITDA |
|
$ |
714,303 |
|
|
$ |
201,461 |
|
|
Adjusted Return on Equity Calculation |
|
Years ended December 31, |
|
|||||
|
($ in thousands, except where in percentages) |
|
2020 |
|
|
2019 |
|
||
|
Numerator: Adjusted Net Income |
|
$ |
523,813 |
|
|
$ |
139,079 |
|
|
Denominator: Average stockholders' equity |
|
|
571,012 |
|
|
|
423,486 |
|
|
Adjusted Return on Equity |
|
|
91.7 |
% |
|
|
32.8 |
% |
|
Return on equity |
|
|
64.9 |
% |
|
|
1.3 |
% |
29
The following table reconciles the valuation adjustment of mortgage servicing rights from the Company’s Consolidated Statements of Income to the change in fair value of MSRs due to model inputs and assumptions included in the reconciliation tables above.
|
Reconciliation of valuation adjustment of mortgage servicing rights to change in fair value of MSRs due to model inputs and assumptions |
|
Year ended December 31, |
|
|||||
|
($ in thousands) |
|
2020 |
|
|
2019 |
|
||
|
Valuation adjustment of mortgage servicing rights |
|
$ |
(296,307 |
) |
|
$ |
(255,219 |
) |
|
Subtract adjustment: |
|
|
|
|
|
|
|
|
|
Change in fair value of MSRs due to collection/realization of cash flows |
|
|
(124,742 |
) |
|
|
(83,821 |
) |
|
Change in fair value of MSRs due to model inputs and assumptions |
|
$ |
(171,565 |
) |
|
$ |
(171,398 |
) |
Results of Operations for the Years Ended December 31, 2020 and 2019
|
Consolidated Statement of Operations |
|
Year Ended December 31, |
|
|
|
|
|
|
|
|
|
|||||
|
($ in thousands) |
|
2020 |
|
|
2019 |
|
|
$ Change |
|
|
% Change |
|
||||
|
Loan origination fees and gain on sale of loans, net |
|
$ |
1,759,871 |
|
|
$ |
820,814 |
|
|
$ |
939,057 |
|
|
|
114.4 |
% |
|
Loan servicing and other fees |
|
|
160,237 |
|
|
|
142,705 |
|
|
|
17,532 |
|
|
|
12.3 |
% |
|
Valuation adjustment of mortgage servicing rights |
|
|
(296,307 |
) |
|
|
(255,219 |
) |
|
|
(41,088 |
) |
|
|
16.1 |
% |
|
Interest income |
|
|
57,649 |
|
|
|
58,787 |
|
|
|
(1,138 |
) |
|
|
(1.9 |
)% |
|
Interest expense |
|
|
(60,168 |
) |
|
|
(55,391 |
) |
|
|
(4,777 |
) |
|
|
8.6 |
% |
|
Other income, net |
|
|
765 |
|
|
|
1,193 |
|
|
|
(428 |
) |
|
|
(35.9 |
)% |
|
Net revenue |
|
|
1,622,047 |
|
|
|
712,889 |
|
|
|
909,158 |
|
|
|
127.5 |
% |
|
Salaries, incentive compensation and benefits |
|
|
953,758 |
|
|
|
578,170 |
|
|
|
375,588 |
|
|
|
65.0 |
% |
|
General and administrative |
|
|
101,948 |
|
|
|
63,983 |
|
|
|
37,965 |
|
|
|
59.3 |
% |
|
Occupancy, equipment and communication |
|
|
57,070 |
|
|
|
53,678 |
|
|
|
3,392 |
|
|
|
6.3 |
% |
|
Depreciation and amortization |
|
|
7,501 |
|
|
|
7,333 |
|
|
|
168 |
|
|
|
2.3 |
% |
|
Provision for foreclosure losses |
|
|
7,700 |
|
|
|
3,895 |
|
|
|
3,805 |
|
|
|
97.7 |
% |
|
Total expense |
|
|
1,127,977 |
|
|
|
707,059 |
|
|
|
420,918 |
|
|
|
59.5 |
% |
|
Income before income tax expense |
|
|
494,070 |
|
|
|
5,830 |
|
|
|
488,240 |
|
|
NM |
|
|
|
Income tax expense |
|
|
123,493 |
|
|
|
253 |
|
|
|
123,240 |
|
|
NM |
|
|
|
Net income |
|
$ |
370,577 |
|
|
$ |
5,577 |
|
|
$ |
365,000 |
|
|
NM |
|
|
Net income totaled $370.6 million for the year ended December 31, 2020 compared to $5.6 million for the year ended December 31, 2019. This increase was primarily driven by increased revenue from loan origination fees and gain on sale of loans. This increase in gain on sale of loans was primarily due to an increase in the secondary marketing spread because of market volatility and low interest rates, which caused industry capacity constraints. According to the MBA Mortgage Finance Forecast, average 30-year mortgage rates declined approximately 90 basis points during the year ended December 31, 2020, which led to an increase in refinance activity. Refinance activity represented 61.4% of origination volume in the U.S. mortgage market during the year ended December 31, 2020 compared to 41.5% of origination volume during the year ended December 31, 2019, according to the MBA Mortgage Finance Forecast. As consumer demand for refinancing increased, our gain on sale margins increased. Our origination volume increased by $13.5 billion, or 62.1%, for the year ended December 31, 2020 compared to the year ended December 31, 2019. Additionally, our income from loan servicing and other fees increased by $17.5 million or 12.3% for the year ended December 31, 2020 compared to the year ended December 31, 2019. These increases in loan origination fees and gain on sale of loans, net and loan servicing and other fees were partially offset by a loss associated with the decrease in the fair value of our MSRs resulting from the valuation model impact of a decrease in projected duration of cash flow collection during the period, as described further below. In a declining mortgage interest rate environment, it is typical for us to experience downward MSR valuation adjustments due to the increased likelihood of prepayments for the loans that still exist in our MSR portfolio. However, when rates decline, originations tend to increase as refinance opportunities increase.
Salaries, incentive compensation and benefits expense increased by $375.6 million or 65.0% for the year ended December 31, 2020 compared to the year ended December 31, 2019. This increase primarily resulted from increased variable incentive compensation paid to our origination teams and our hiring of additional employees to support the increases in our origination and servicing volume. General and administrative expense increased by $38.0 million or 59.3% for the year ended December 31, 2020 compared to the year ended December 31, 2019, which was primarily due to an upward adjustment to the fair value of the contingent liabilities related to our completed acquisitions. During the year ended December 31, 2020, we recorded $31.7 million of expense related to earn-out valuation adjustments compared to $7.9 million during the year ended December 31, 2019. Additionally, there was an increase in professional fees paid to third party vendors to support the growth in our origination volume during the period and additional legal, accounting, and other costs related to becoming a public company.
30
Revenue
Loan Origination Fees and Gain on Sale of Loans, Net
The table below provides additional detail regarding the loan origination fees and gain on sale of loans, net for the periods presented.
|
|
|
Year Ended December 31, |
|
|
|
|
|
|
|
|
|
|||||
|
($ in thousands) |
|
2020 |
|
|
2019 |
|
|
$ Change |
|
|
% Change |
|
||||
|
Gain on sale of loans |
|
$ |
1,229,852 |
|
|
$ |
601,672 |
|
|
$ |
628,180 |
|
|
|
104.4 |
% |
|
Loan origination fees |
|
|
111,010 |
|
|
|
68,067 |
|
|
|
42,943 |
|
|
|
63.1 |
% |
|
Fair value of originated MSRs |
|
|
308,042 |
|
|
|
141,742 |
|
|
|
166,300 |
|
|
|
117.3 |
% |
|
Fair value adjustment to MLHS and IRLCs |
|
|
151,465 |
|
|
|
14,241 |
|
|
|
137,224 |
|
|
NM |
|
|
|
Changes in fair value of forward commitments |
|
|
(33,407 |
) |
|
|
5,295 |
|
|
|
(38,702 |
) |
|
NM |
|
|
|
Provision for investor reserves |
|
|
(7,091 |
) |
|
|
(10,203 |
) |
|
|
3,112 |
|
|
|
(30.5 |
)% |
|
Total loan origination fees and gain on sale of loans, net |
|
$ |
1,759,871 |
|
|
$ |
820,814 |
|
|
$ |
939,057 |
|
|
|
114.4 |
% |
The table below provides additional detail regarding the composition of our origination volume and other key performance indicators for the periods presented.
|
|
|
Year Ended December 31, |
|
|
|
|
|
|
|
|
|
|||||
|
($ and units in thousands) |
|
2020 |
|
|
2019 |
|
|
Change |
|
|
% Change |
|
||||
|
Loan origination volume by type: |
|
|
|
|
|
|
|
|
|
|
|
|
|
|
|
|
|
Conventional conforming |
|
$ |
24,479,231 |
|
|
$ |
12,524,685 |
|
|
$ |
11,954,546 |
|
|
|
95.4 |
% |
|
Government |
|
|
8,340,279 |
|
|
|
6,543,065 |
|
|
|
1,797,214 |
|
|
|
27.5 |
% |
|
State housing |
|
|
1,916,033 |
|
|
|
1,711,012 |
|
|
|
205,021 |
|
|
|
12.0 |
% |
|
Non-agency |
|
|
449,985 |
|
|
|
932,906 |
|
|
|
(482,921 |
) |
|
|
(51.8 |
)% |
|
Total in-house originations(1) |
|
$ |
35,185,528 |
|
|
$ |
21,711,668 |
|
|
$ |
13,473,860 |
|
|
|
62.1 |
% |
|
Brokered loans |
|
$ |
80,368 |
|
|
$ |
136,106 |
|
|
$ |
(55,738 |
) |
|
|
(41.0 |
)% |
|
Total originations |
|
$ |
35,265,896 |
|
|
$ |
21,847,774 |
|
|
$ |
13,418,122 |
|
|
|
61.4 |
% |
|
In-house loans closed |
|
|
125 |
|
|
|
81 |
|
|
|
44 |
|
|
|
54.3 |
% |
|
Average loan amount |
|
$ |
281 |
|
|
$ |
270 |
|
|
$ |
11 |
|
|
|
4.1 |
% |
|
Purchase |
|
|
46.2 |
% |
|
|
64.9 |
% |
|
|
(18.7 |
)% |
|
|
(28.8 |
)% |
|
Refinance |
|
|
53.8 |
% |
|
|
35.1 |
% |
|
|
18.7 |
% |
|
|
53.3 |
% |
|
Service retained(2) |
|
|
90.4 |
% |
|
|
66.5 |
% |
|
|
23.9 |
% |
|
|
35.9 |
% |
|
Service released(3) |
|
|
9.6 |
% |
|
|
33.5 |
% |
|
|
(23.9 |
)% |
|
|
(71.3 |
)% |
|
Gain-on-sale margin (bps)(4) |
|
|
500 |
|
|
|
378 |
|
|
|
122 |
|
|
|
32.3 |
% |
|
Total locked volume(5) |
|
$ |
44,668,986 |
|
|
$ |
25,598,331 |
|
|
$ |
19,070,655 |
|
|
|
74.5 |
% |
|
Pull-through adjusted lock volume(6) |
|
$ |
39,200,359 |
|
|
$ |
22,884,908 |
|
|
$ |
16,315,451 |
|
|
|
71.3 |
% |
|
Weighted average loan-to-value |
|
|
79.9 |
% |
|
|
84.9 |
% |
|
|
(5.0 |
)% |
|
|
(5.9 |
)% |
|
Weighted average credit score |
|
|
757 |
|
|
|
732 |
|
|
|
25 |
|
|
|
3.4 |
% |
|
Weighted average note rate |
|
|
3.2 |
% |
|
|
4.2 |
% |
|
|
(1.0 |
)% |
|
|
(23.8 |
)% |
|
Days application to close |
|
|
51 |
|
|
|
41 |
|
|
|
10 |
|
|
|
24.4 |
% |
|
Days close to purchase by investors |
|
|
15 |
|
|
|
17 |
|
|
|
(2 |
) |
|
|
(11.8 |
)% |
|
Purchase recapture rate |
|
|
25.8 |
% |
|
|
25.6 |
% |
|
|
0.2 |
% |
|
|
0.8 |
% |
|
Refinance recapture rate |
|
|
65.6 |
% |
|
|
63.9 |
% |
|
|
1.7 |
% |
|
|
2.7 |
% |
|
(1) |
Includes retail and correspondent loans and excludes brokered loans. |
|
(2) |
Represents loans sold for which we continue to act as the servicer. |
|
(3) |
Represents loans sold for which we do not continue to act as the servicer. |
|
(4) |
Represents the components of loan origination fees and gain on sales of loans, net described under “—Our Components of Revenue” divided by total in-house origination to derive basis points. Our gain-on-sale margin based on pull-through adjusted lock volume was 449 basis points and 359 basis points for the years ended December 31, 2020 and December 31, 2019, respectively. Gain-on-sale margin based on pull-through adjusted lock volume represents the components of loan origination fees and gain on sales of loans, net described under “—Our Components of Revenue” divided by pull-through adjusted lock volume. |
|
(5) |
Total locked volume represents the aggregate dollar value of the potential loans for which the Company has agreed to extend credit to consumers at specified rates for a specified period of time, subject to certain contingencies that are described in the IRLCs between the Company and each of those consumers. The total locked volume for a given period is representative of the IRLCs that the Company has initially entered into during that period. |
|
(6) |
Pull-through adjusted lock volume equal to total locked volume multiplied by pull-through rates of 87.8% and 89.4% for the years ended December 31, 2020 and December 31, 2019, respectively. We estimate the pull-through rate based on changes in pricing and actual borrower behavior using a historical analysis of loan closing data and “fallout” data with respect to the number of commitments that have historically remained unexercised. |
Gain on sale of loans increased by $628.2 million or 104.4% for the year ended December 31, 2020 compared to the year ended December 31, 2019 due to a $13.2 billion or 62.3% increase in loan sales for the same period. Additionally, gain on sale margins on originated loans increased by 122 basis points or 32.3% for the year ended December 31, 2020 compared to the year ended December 31, 2019.
31
The initial fair value recorded for our originated MSRs increased by $166.3 million or 117.3% for the year ended December 31, 2020 compared to the year ended December 31, 2019. This increase was primarily caused by an increase in our origination volume, which increased $13.5 billion or 62.1% for the same period, as well as an increase in the percentage of our loans sold for which we continued to act as the servicer (i.e., on a “service retained” basis). During the year ended December 31, 2020, we retained 90.4% of our origination volume compared to 66.5% of our origination volume for the year ended December 31, 2019.
Adjustments to the recorded fair value of our MLHS and IRLCs, net of any related changes in the recorded fair value of our forward delivery commitments, resulted in a gain of $118.1 million for the year ended December 31, 2020 compared to $19.5 million for the year ended December 31, 2019. This gain partially resulted from increased origination volume for the same time period as described above. Additionally, total volume of IRLCs during the year ended December 31, 2020 was $44.7 billion compared to $25.6 billion for the year ended December 31, 2019, an increase of $19.1 million or 74.5%. Lastly, this increase is due in part to the increased gain on sale margins on originated loans of 122 basis points or 32.3% for the year ended December 31, 2020 compared to the year ended December 31, 2019, and increased gain on sale margins on pull-through adjusted lock volume of 90 basis points or 25.1% during the same time period.
In response to our increased origination volume, origination fee income increased by $42.9 million or 63.1% for the year ended December 31, 2020 compared to the year ended December 31, 2019.
Our provision for investor reserves decreased by $3.1 million or 30.5% for the year ended December 31, 2020 compared to the year ended December 31, 2019. An assessment of trending historical and current claims showed that current claim activity in relation to origination volume is lower than previously anticipated, and as such we reduced a portion of our reserve in the year ended December 31, 2020. We continue to monitor investor reserves and potential losses regularly to assess if further changes are needed.
Loan Servicing and Other Fees
The table below provides additional details regarding our loan servicing and other fees for the periods presented.
|
|
|
Year Ended December 31, |
|
|
|
|
|
|
|
|
|
|||||
|
($ in thousands) |
|
2020 |
|
|
2019 |
|
|
$ Change |
|
|
% Change |
|
||||
|
Servicing fee income |
|
$ |
155,362 |
|
|
$ |
138,201 |
|
|
$ |
17,161 |
|
|
|
12.4 |
% |
|
Other ancillary fees |
|
|
5,659 |
|
|
|
5,999 |
|
|
|
(340 |
) |
|
|
(5.7 |
)% |
|
Loan modification fees |
|
|
1,008 |
|
|
|
635 |
|
|
|
373 |
|
|
|
58.7 |
% |
|
Interest on impound accounts |
|
|
(1,792 |
) |
|
|
(2,130 |
) |
|
|
338 |
|
|
|
(15.9 |
)% |
|
Total servicing fees |
|
$ |
160,237 |
|
|
$ |
142,705 |
|
|
$ |
17,532 |
|
|
|
12.3 |
% |
The table below provides additional details regarding our servicing portfolio composition and key performance indicators for the period presented.
|
|
|
Year Ended December 31, |
|
|
|
|
|
|
|
|
|
|||||
|
($ and units in thousands) |
|
2020 |
|
|
2019 |
|
|
Change |
|
|
% Change |
|
||||
|
Beginning UPB of servicing portfolio(1) |
|
$ |
49,326,579 |
|
|
$ |
45,496,129 |
|
|
$ |
3,830,450 |
|
|
|
8.4 |
% |
|
New UPB origination additions(2) |
|
|
35,185,528 |
|
|
|
21,711,668 |
|
|
|
13,473,860 |
|
|
|
62.1 |
% |
|
Less: |
|
|
|
|
|
|
|
|
|
|
|
|
|
|
|
|
|
UPB originations sold service released(3) |
|
$ |
3,377,997 |
|
|
$ |
7,122,270 |
|
|
$ |
(3,744,273 |
) |
|
|
(52.6 |
)% |
|
Loan payoffs |
|
|
19,605,379 |
|
|
|
9,374,095 |
|
|
|
10,231,284 |
|
|
|
109.1 |
% |
|
Loan principal reductions |
|
|
1,512,002 |
|
|
|
1,300,240 |
|
|
|
211,762 |
|
|
|
16.3 |
% |
|
Loan foreclosures |
|
|
47,076 |
|
|
|
84,613 |
|
|
|
(37,537 |
) |
|
|
(44.4 |
)% |
|
Ending UPB of servicing portfolio |
|
$ |
59,969,653 |
|
|
$ |
49,326,579 |
|
|
$ |
10,643,074 |
|
|
|
21.6 |
% |
|
Average UPB of servicing portfolio |
|
$ |
54,648,116 |
|
|
$ |
47,411,354 |
|
|
$ |
7,236,762 |
|
|
|
15.3 |
% |
|
Weighted average servicing fee |
|
|
0.30 |
% |
|
|
0.30 |
% |
|
|
— |
|
|
|
0.0 |
% |
|
Weighted average coupon rate |
|
|
3.6 |
% |
|
|
4.2 |
% |
|
|
(0.6 |
)% |
|
|
(14.3 |
)% |
|
Weighted average prepayment speed(4) |
|
|
18.8 |
% |
|
|
17.5 |
% |
|
|
1.3 |
% |
|
|
7.4 |
% |
|
Weighted average credit score |
|
|
730 |
|
|
|
721 |
|
|
|
9.0 |
|
|
|
1.2 |
% |
|
Weighted average loan age (in months) |
|
|
23.1 |
|
|
|
29.6 |
|
|
|
(6.5 |
) |
|
|
(22.0 |
)% |
|
Weighted average loan-to-value |
|
|
82.1 |
% |
|
|
84.2 |
% |
|
|
(2.1 |
)% |
|
|
(2.5 |
)% |
|
MSR multiple (period end)(5) |
|
|
2.7 |
|
|
|
2.9 |
|
|
|
(0.2 |
) |
|
|
(6.9 |
)% |
|
Loans serviced (period end) |
|
|
271 |
|
|
|
237 |
|
|
|
34.0 |
|
|
|
14.3 |
% |
|
Loans delinquent 60-plus days (period end) |
|
|
10.0 |
|
|
|
4.4 |
|
|
|
5.6 |
|
|
|
127.3 |
% |
|
Loan delinquency rate 60-plus days (period end) |
|
|
3.5 |
% |
|
|
1.6 |
% |
|
|
1.9 |
% |
|
|
118.8 |
% |
|
(1) |
We previously purchased two servicing portfolios that totaled $844.6 million and $1.3 billion at December 31, 2020 and 2019, respectively, that are currently being subserviced by a third party and are excluded from these numbers. |
|
(2) |
Includes all in-house loans originated in period, irrespective if it is eventually sold, service retained or service released. |
|
(3) |
Represents loans sold for which we do not continue to act as the servicer of the loan. |
32
|
(4) |
Represents the percentage of UPB that will pay off ahead of time in each period, calculated as an annual rate. |
|
(5) |
Represents a metric used to determine the relative value of our MSRs in relation to our annualized retained servicing fee. It is calculated by dividing (a) the fair market value of our MSRs as of a specified date by (b) the weighted average annualized retained servicing fee for our servicing portfolio as of such date. We exclude purchased MSRs from this calculation because our servicing portfolio consists primarily of originated MSRs and, consequently, purchased MSRs do not have a material impact on our weighted average service fee. |
Total loan servicing and other fees increased $17.5 million or 12.3% for the year ended December 31, 2020 compared to the year ended December 31, 2019 due to the increase in our average servicing portfolio, which increased 15.3% over the same time period. Although the increase in loan servicing and other fees is directionally consistent with our average servicing portfolio growth over the same time period, we are earning slightly lower than normal servicing and ancillary fee income due to the inability to collect late charges and servicing fees for customers who have elected to accept forbearance relief under the CARES Act. Those clients are currently not required to make their mortgage payments. In February 2021 the federal government announced an extension of the loan forbearance relief program of three to six months depending on loan type.
Valuation Adjustment of Mortgage Servicing Rights
The table below presents our MSR valuation adjustment for the periods presented.
|
|
|
Year Ended December 31, |
|
|
|
|
|
|
|
|
|
|||||
|
($ in thousands) |
|
2020 |
|
|
2019 |
|
|
$ Change |
|
|
% Change |
|
||||
|
MSR valuation adjustment |
|
$ |
(296,307 |
) |
|
$ |
(255,219 |
) |
|
$ |
(41,088 |
) |
|
|
16.1 |
% |
The fair value of our MSRs declined by $296.3 million for the year ended December 31, 2020 compared to a decline of $255.2 million for the year ended December 31, 2019. The fair value of our MSRs generally declines as interest rates decline and prepayments increase. Average 30-year mortgage rates declined by 90 basis points during the year ended December 31, 2020. Our refinance recapture rate was 66% for the year ended December 31, 2020 and 64% for the year ended December 31, 2019. The weighted average coupon rate of loans for which we have an MSR decreased from 4.2% at December 31, 2019 to 3.6% at December 31, 2020.
Interest Income
Interest income decreased by $1.1 million or 1.9% for the year ended December 31, 2020 compared to the year ended December 31, 2019. This is primarily due to a decrease in interest income earnings credits of $8.1 million or 71.2%. Additionally, there was a decrease in the weighted average note rate of originated loans, which were held for sale for an average of 15 days before being sold to an investor, from 4.2% for the year ended December 31, 2019 to 3.2% for the year ended December 31, 2020. These decreases were partially offset by an increase in interest income, funding of $5.1 million or 11.9%. Although the increase in interest income, funding is directionally consistent with our increase in origination volume of 62.1%, we are earning lower than normal interest income due to the decreased interest rates described above.
Interest Expense
Interest expense increased $4.8 million or 8.6% for the year ended December 31, 2020 compared to the year ended December 31, 2019. Payoff interest expense increased by $4.2 million or 69.3% for the same time period, primarily due to increased payoff volume. When a client pays off their loan with us, the client pays interest only up until the date of payoff. As a seller-servicer, however, for loans sold through Agency MBS we are required to remit the full month of interest to the investors who purchase the loans we originate, even though the client will not pay a full month of interest for that month. Our loan prepayments increased by $10.2 billion or 109.1% for the year ended December 31, 2020 compared to the year ended December 31, 2019. Additionally, bank servicing charges and collateral handling fees increased $1.7 million or 24.3% for the year ended December 31, 2020 compared to the year ended December 31, 2019 due to increased origination volume for the same time period. These increases were partially offset by a decrease in interest expense related to warehouse lines of credit of $2.1 million or 6.4% for the same time period. Our warehouse lines of credit costs are generally aligned with LIBOR and therefore, as these rates decreased by 1.6% from December 31, 2019 to December 31, 2020, our cost of funds decreased accordingly.
Other Income, Net
Changes in other income, net for the year ended December 31, 2020 compared to the year ended December 31, 2019 were immaterial to the overall results of operations.
Summary of Expenses:
|
|
|
Year Ended December 31, |
|
|
|
|
|
|
|
|
|
|||||
|
($ in thousands) |
|
2020 |
|
|
2019 |
|
|
$ Change |
|
|
% Change |
|
||||
|
Salaries, incentive compensation and benefits |
|
$ |
953,758 |
|
|
$ |
578,170 |
|
|
$ |
375,588 |
|
|
|
65.0 |
% |
|
General and administrative |
|
|
101,948 |
|
|
|
63,983 |
|
|
|
37,965 |
|
|
|
59.3 |
% |
|
Occupancy, equipment and communication |
|
|
57,070 |
|
|
|
53,678 |
|
|
|
3,392 |
|
|
|
6.3 |
% |
|
Depreciation and amortization |
|
|
7,501 |
|
|
|
7,333 |
|
|
|
168 |
|
|
|
2.3 |
% |
|
Provision for foreclosure losses |
|
|
7,700 |
|
|
|
3,895 |
|
|
|
3,805 |
|
|
|
97.7 |
% |
|
Total expenses |
|
$ |
1,127,977 |
|
|
$ |
707,059 |
|
|
$ |
420,918 |
|
|
|
59.5 |
% |
33
Salaries, Incentive Compensation and Benefits
A breakdown of the components of salaries, incentive compensation and benefits expense is provided below.
|
Salaries, Incentive Compensation and Benefits |
|
Year Ended December 31, |
|
|
|
|
|
|
|
|
|
|||||
|
($ in thousands) |
|
2020 |
|
|
2019 |
|
|
$ Change |
|
|
% Change |
|
||||
|
Incentive Compensation |
|
$ |
558,240 |
|
|
$ |
303,736 |
|
|
$ |
254,504 |
|
|
|
83.8 |
% |
|
Salaries |
|
|
279,482 |
|
|
|
211,868 |
|
|
|
67,614 |
|
|
|
31.9 |
% |
|
Benefits |
|
|
116,036 |
|
|
|
62,566 |
|
|
|
53,470 |
|
|
|
85.5 |
% |
|
Total salaries, incentive compensation and benefits expense |
|
$ |
953,758 |
|
|
$ |
578,170 |
|
|
$ |
375,588 |
|
|
|
65.0 |
% |
Salaries, incentive compensation and benefits expense increased by $375.6 million or 65.0% for the year ended December 31, 2020 compared to the year ended December 31, 2019.
Incentive compensation expense increased by $254.5 million or 83.8% for the year ended December 31, 2020 compared to the year ended December 31, 2019 due to an increase in variable incentive compensation paid to sales teams based on the increase in our origination volume during that period.
Salaries expense increased by $67.6 million or 31.9% for the year ended December 31, 2020 compared to the year ended December 31, 2019. This is primarily because we hired additional permanent and temporary employees and paid increased variable bonus and overtime to support the increase in our origination and servicing volumes during the year.
Benefits expense increased by $53.5 million or 85.5% for the year ended December 31, 2020 compared to the year ended December 31, 2019, primarily due to an increase in the fair value of the deferred compensation plan for certain executive employees of the Company of $30.3 million. Prior to becoming a public company, this deferred compensation plan was tied to the Company’s net worth, which increased from $406.0 million at December 31, 2019 to $688.9 million at September 30, 2020. Additionally, employee profit sharing, a portion of which is tied to the Company’s net income, increased $9.5 million. Lastly, employment taxes increased due to increased personnel expenses.
General and Administrative
A breakdown of general and administrative expense is provided below.
|
General and Administrative Expense |
|
Year Ended December 31, |
|
|
|
|
|
|
|
|
|
|||||
|
($ in thousands) |
|
2020 |
|
|
2019 |
|
|
$ Change |
|
|
% Change |
|
||||
|
Contingent liability fair value adjustment |
|
$ |
31,705 |
|
|
$ |
7,920 |
|
|
$ |
23,785 |
|
|
|
300.3 |
% |
|
Professional fees |
|
|
36,593 |
|
|
|
23,434 |
|
|
|
13,159 |
|
|
|
56.2 |
% |
|
Advertising and promotions |
|
|
17,249 |
|
|
|
17,620 |
|
|
|
(371 |
) |
|
|
(2.1 |
)% |
|
Office supplies, travel and entertainment |
|
|
8,553 |
|
|
|
10,452 |
|
|
|
(1,899 |
) |
|
|
(18.2 |
)% |
|
Miscellaneous |
|
|
7,848 |
|
|
|
4,557 |
|
|
|
3,291 |
|
|
|
72.2 |
% |
|
Total general and administrative expense |
|
$ |
101,948 |
|
|
$ |
63,983 |
|
|
$ |
37,965 |
|
|
|
59.3 |
% |
General and administrative expense increased by $38.0 million or 59.3% for the year ended December 31, 2020 compared to the year ended December 31, 2019.
Approximately $23.8 million of this increase in general and administrative expense resulted from an adjustment to the fair value of the contingent liabilities related to our completed acquisitions.
Professional fees increased by $13.2 million or 56.2% for the year ended December 31, 2020 compared to the year ended December 31, 2019. This increase in professional fees arose primarily from an increase of $7.2 million in fees paid to third party vendors to support the growth in our origination volume during the period. We also incurred additional legal, accounting, and other costs related to becoming a public company.
Miscellaneous expense increased by $3.3 million or 72.2% for the year ended December 31, 2020 compared to the year ended December 31, 2019, primarily due to higher miscellaneous loan level costs arising from our increased origination and servicing volume during the period.
Occupancy, Equipment and Communication
A breakdown of the components of occupancy, equipment and communication expense is provided below.
|
Occupancy, Equipment and Communication Expense |
|
Year Ended December 31, |
|
|
|
|
|
|
|
|
|
|||||
|
($ in thousands) |
|
2020 |
|
|
2019 |
|
|
$ Change |
|
|
% Change |
|
||||
|
Occupancy |
|
$ |
34,082 |
|
|
$ |
33,428 |
|
|
$ |
654 |
|
|
|
2.0 |
% |
|
Equipment |
|
|
7,671 |
|
|
|
6,494 |
|
|
|
1,177 |
|
|
|
18.1 |
% |
|
Communication |
|
|
15,317 |
|
|
|
13,756 |
|
|
|
1,561 |
|
|
|
11.3 |
% |
|
Total occupancy, equipment and communication expense |
|
$ |
57,070 |
|
|
$ |
53,678 |
|
|
$ |
3,392 |
|
|
|
6.3 |
% |
Occupancy, equipment and communication expense increased by $3.4 million or 6.3% for the year ended December 31, 2020 compared to the year ended December 31, 2019. Occupancy costs generally consist of fixed
34
costs and remain consistent except for the typical increase in building rental expense each year, which is usually aligned with inflation, and except for any increases associated with new acquisitions, expansion into new territories and entry into new material building leases. Communication expense increased $1.6 million for the year ended December 31, 2020 compared to the year ended December 31, 2019 due to the needs of a remote working environment because of COVID-19-related restrictive measures.
Depreciation and Amortization
Depreciation and amortization expense increased $0.2 million for the year ended December 31, 2020 compared to the year ended December 31, 2019, primarily as a result of leasehold improvements including technology upgrades to support our growth.
Provision for Foreclosure Losses
Provision for foreclosure losses expense increased by $3.8 million or 97.7% for the year ended December 31, 2020 compared to the year ended December 31, 2019. Although we have experienced a decrease in overall foreclosure starts and sales due to the CARES Act’s foreclosure moratorium and the federal government’s subsequent extension of its mortgage forbearance programs, we have increased our foreclosure loss reserves due to increases in significant delinquencies, which are associated with higher costs. Additionally, we anticipate an increase in the time needed to complete a foreclosure due to expected delays and backlogs throughout the foreclosure process. We continue to monitor foreclosure reserves and potential losses regularly to assess if further changes are needed.
Summary Results by Segment for the Years Ended December 31, 2020 and 2019
Our operations are comprised of two distinct but related reportable segments that we refer to as our origination and servicing segments. We operate our origination segment from approximately 202 office locations. Our licensed sales professionals and support staff cultivate deep relationships with our referral partners and clients and provide a customized approach to the loan transaction, whether it is a purchase or a refinance. Although our origination and servicing segments are separated for this presentation, management sees the two segments as intricately related and interdependent. We believe that our servicing segment provides a steady stream of revenue to support our origination segment and that, more importantly, our servicing segment positions us to build longstanding client relationships that drive repeat and referral business back to the origination segment to recapture our clients’ future mortgage transactions. In particular, the growth of our servicing segment is dependent on the continued growth of our origination volume because our servicing portfolio consists primarily of originated MSRs.
We measure the performance of our segments primarily based on their net income (loss). See below for an overview and discussion of each of our segments’ results for the years ended December 31, 2020 and December 31, 2019. These results do not include unallocated corporate costs.
Origination
|
|
|
For the Years Ended |
|
|||||
|
($ and units in thousands) |
|
December 31, 2020 |
|
|
December 31, 2019 |
|
||
|
Funded loans |
|
$ |
35,185,528 |
|
|
$ |
21,711,668 |
|
|
Funded loans |
|
|
125 |
|
|
|
81 |
|
|
Loan origination fees and gain on sale |
|
$ |
1,753,517 |
|
|
$ |
817,293 |
|
|
Interest income (expense) |
|
|
13,993 |
|
|
|
9,702 |
|
|
Other income, net |
|
|
25 |
|
|
|
38 |
|
|
Net revenue |
|
|
1,767,535 |
|
|
|
827,033 |
|
|
Salaries, incentive compensation and benefits |
|
|
864,322 |
|
|
|
548,056 |
|
|
Occupancy, equipment and communication |
|
|
48,233 |
|
|
|
48,115 |
|
|
Production technology |
|
|
20,042 |
|
|
|
18,625 |
|
|
General and administrative |
|
|
64,957 |
|
|
|
24,403 |
|
|
Depreciation and amortization |
|
|
4,644 |
|
|
|
6,417 |
|
|
Total expenses |
|
|
1,002,198 |
|
|
|
645,616 |
|
|
Net income allocated to origination |
|
$ |
765,337 |
|
|
$ |
181,417 |
|
Years ended December 31, 2020 and 2019
The origination segment’s net income increased by $583.9 million or 321.9% for the year ended December 31, 2020 compared to the year ended December 31, 2019. This change was primarily driven by increased revenue earned from loan origination fees and gain on sale of loans, net of $936.2 million or 114.6% for the year ended December 31, 2020 compared to the year ended December 31, 2019. Average 30-year mortgage rates declined approximately 90 basis points during the year ended December 31, 2020, which led to an increase in refinance activity. Refinance activity represented 61.4% of origination volume in the U.S. mortgage market during the year ended December 31, 2020 compared to 41.5% of origination volume during the year ended December 31, 2019. As consumer demand for refinancing increased, our gain on sale margins increased. Our origination volume increased 62.1% for the year ended December 31, 2020 compared to the year ended December 31, 2019. Additionally, gain on sale margins on originated loans increased 122 basis points or 32.3% for the same time period.
Salaries, incentive compensation and benefits expense increased by $316.3 million or 57.7% for the year ended December 31, 2020 compared to the year ended December 31, 2019 due to increased variable incentive compensation paid to our origination teams and our hiring of additional employees to support the increase in our
35
origination volume. General and administrative expense increased by $40.6 million or 166.2% for the year ended December 31, 2020 compared to the year ended December 31, 2019, primarily due to a $23.8 million increase in the adjustment to the fair value of the contingent liabilities related to our completed acquisitions.
Servicing
|
|
|
For the Years Ended |
|
|||||
|
($ and units in thousands) |
|
December 31, 2020 |
|
|
December 31, 2019 |
|
||
|
UPB of servicing portfolio (period end) |
|
$ |
59,969,653 |
|
|
$ |
49,326,579 |
|
|
Loans serviced (period end) |
|
|
271 |
|
|
|
237 |
|
|
Loan servicing and other fees |
|
$ |
160,237 |
|
|
$ |
142,705 |
|
|
Loan origination fees and gain on sale, net |
|
|
6,354 |
|
|
|
3,521 |
|
|
Other income, net |
|
|
133 |
|
|
|
— |
|
|
Total revenue |
|
|
166,724 |
|
|
|
146,226 |
|
|
Valuation adjustment of MSRs |
|
|
(296,307 |
) |
|
|
(255,219 |
) |
|
Interest income (expense) |
|
|
(8,068 |
) |
|
|
2,674 |
|
|
Net revenue |
|
|
(137,651 |
) |
|
|
(106,319 |
) |
|
Salaries, incentive compensation and benefits |
|
|
25,075 |
|
|
|
15,538 |
|
|
Occupancy, equipment and communication |
|
|
3,524 |
|
|
|
2,078 |
|
|
General and administrative |
|
|
2,072 |
|
|
|
5,145 |
|
|
Servicing technology |
|
|
7,198 |
|
|
|
5,162 |
|
|
Provision for foreclosure losses |
|
|
7,700 |
|
|
|
3,895 |
|
|
Depreciation and amortization |
|
|
777 |
|
|
|
326 |
|
|
Total expenses |
|
|
46,346 |
|
|
|
32,144 |
|
|
Net loss allocated to servicing |
|
$ |
(183,997 |
) |
|
$ |
(138,463 |
) |
Years ended December 31, 2020 and 2019
Our servicing segment incurred a net loss of $184.0 million for the year ended December 31, 2020 compared to $138.5 million for the year ended December 31, 2019. This increase in net loss was primarily driven by $296.3 million in adjustments to the fair value of our MSRs during the year ended December 31, 2020 compared to $255.2 million in adjustments to the fair value of our MSRs during the year ended December 31, 2019. The fair value of our MSRs generally declines as interest rates decline and as prepayments increase. Average 30-year mortgage rates declined by 90 basis points during the year ended December 31, 2020. Although loan servicing and other fees increased by $17.5 million or 12.3% for the year ended December 31, 2020 compared to the year ended December 31, 2019, we are earning slightly lower than normal servicing and ancillary fee income due to the inability to collect late charges and servicing fees for customers who have elected to accept forbearance relief under the CARES Act. The increase in loan servicing and other fees was partially offset by interest expense of $8.1 million for the year ended December 31, 2020 compared to interest income of $2.7 million for the year ended December 31, 2019. This increase in interest expense is due to a decrease in interest income earnings credits of $8.1 million or 71.2% for this time period. Additionally, there was an increase in payoff interest expense of $4.2 million or 69.3% due to an increase of $10.2 billion or 109.1% in loan prepayments for this time period.
Salaries, incentive compensation and benefits increased by $9.5 million or 61.4% for the year ended December 31, 2020 compared to the year ended December 31, 2019 due to our hiring of additional employees to support the increase in our servicing volume and to support the needs of clients who elected to accept forbearance relief under the CARES Act. Additionally, our foreclosure loss provisions increased by $3.8 million or 97.7% due to increases in significant delinquencies, which are associated with higher costs, as well as an anticipated increase in the time needed to complete a foreclosure due to expected delays and backlogs throughout the foreclosure process.
36
Liquidity, Capital Resources and Cash Flows
Historically, our primary sources of liquidity have included:
|
|
• |
cash flows from our operations, including: |
|
|
• |
sale of whole loans into the secondary market; |
|
|
• |
loan origination fees; |
|
|
• |
servicing fee income; and |
|
|
• |
interest income on MLHS; |
|
|
• |
borrowings on warehouse lines of credit to originate mortgage loans; and |
|
|
• |
borrowings on our MSR notes payable. |
Historically, our primary uses of funds have included:
|
|
• |
cash flows from our operations, including but not limited to: |
|
|
• |
origination of MLHS; |
|
|
• |
payment of interest expense; and |
|
|
• |
payment of operating expenses; |
|
|
• |
repayments on warehouse lines of credit; |
|
|
• |
distributions to shareholders prior to our IPO; and |
|
|
• |
acquisitions of other mortgage businesses. |
We are also subject to contingencies which may have a significant effect on the use of our cash. We believe that our cash flows from operations and other available sources of liquidity will be sufficient to fund our operations for the next 12 months.
In order to originate and aggregate loans for sale into the secondary market, we use our own working capital and borrow or obtain money on a short-term basis, primarily through committed and uncommitted loan funding facilities that we have established with large national and global banks.
Our loan funding facilities are primarily in the form of master repurchase agreements, which we refer to as “warehouse lines of credit.” Loans financed under these facilities are generally financed at approximately 97% to 98% of the principal balance of the loan (although certain types of loans are financed at lower percentages of the principal balance of the loan), which requires us to fund the balance from cash generated from our operations. Once closed, the underlying residential mortgage loan that is held for sale is pledged as collateral for the borrowing or advance that was made under these loan funding facilities. In most cases, the loans will remain in one of the loan funding facilities for only a short time, generally less than one month, until the loans are pooled and sold. During the time the loans are held for sale, we earn interest income from the borrower on the underlying mortgage loan. This income is partially offset by the interest and fees we must pay under the loan funding facilities.
When we sell a pool of loans in the secondary market, the proceeds received from the sale of the loans are used to pay back the amounts we owe on the loan funding facilities. We rely on the cash generated from the sale of loans to fund future loans and repay borrowings under our loan funding facilities. Delays or failures to sell loans in the secondary market could have an adverse effect on our liquidity position.
As discussed in Note 12, Warehouse Lines of Credit to the consolidated financial statements included in Item 8, as of December 31, 2020, we had eight different loan funding facilities in different amounts and with various maturities. As of December 31, 2020, the aggregate available amount under our loan facilities was approximately $3.0 billion, with combined outstanding balances of approximately $2.1 billion.
As discussed in Note 13, Notes Payable to the consolidated financial statements included in Item 8, as of December 31, 2020, we had three different MSR notes payable in different amounts with different maturities. As of December 31, 2020, the aggregate available amount under our MSR notes payable was $415.0 million, with combined outstanding balances of $145.8 million and unutilized capacity of $70.9 million, based on total committed amounts and our borrowing base limitations. The borrowing capacity under our MSR notes payable is restricted by the valuation of our servicing portfolio.
The amount of financing advanced on each individual loan under our loan funding facilities is determined by agreed upon advance rates but may be less than the stated rate due to fluctuations in the market value of the mortgage loans securing the financings. If the lenders providing the funds under our loan funding facilities determine that the value of the loans serving as collateral for our borrowings under those facilities has decreased, they can initiate a margin call to require us to provide additional collateral or reduce the amount outstanding with respect to those loans. Our inability or unwillingness to satisfy such a request could result in the termination of the related facilities and a potential default under our other loan funding facilities. In addition, a large unanticipated margin call could have a material adverse effect on our liquidity.
The amount owed and outstanding under our loan funding facilities fluctuates significantly based on our origination volume, the amount of time it takes us to sell the loans we originate and the amount of loans we are self-funding with cash. We may from time to time post surplus cash as additional collateral to buy-down the effective interest rates of certain loan funding facilities or to self-fund a portion of our loan originations. As of December 31, 2020, we had posted $15.6 million in cash as additional collateral. We have the ability to draw back this additional collateral at any time unless a margin call has been made or a default has occurred under the relevant facilities.
We also have an early buyout facility that allows us to purchase certain delinquent GNMA loans that we service and finance them on the facility until the loan is cured or subsequently sold. The capacity of this uncommitted facility is $75.0 million and, at December 31, 2020, the outstanding balance on the facility was $25.2 million.
37
Our loan funding facilities and MSR notes payable generally require us to comply with certain operating and financial covenants and the availability of funds under these facilities are subject to, among other conditions, our continued compliance with these covenants. These financial covenants include, but are not limited to, maintaining a certain (i) minimum tangible net worth, (ii) minimum liquidity and (iii) a maximum ratio of total liabilities or total debt to tangible net worth and satisfying certain pre-tax net income requirements. A breach of these covenants could result in an event of default under our funding facilities, which would allow the related lenders to pursue certain remedies. In addition, each of these facilities includes cross default or cross acceleration provisions that could result in all of our funding facilities terminating if an event of default or acceleration of maturity occurs under any one of them. We believe we were in compliance with all of these covenants as of December 31, 2020 and December 31, 2019.
Our debt obligations are summarized below by facility as of December 31, 2020:
|
Facility ($ in thousands) |
|
Outstanding Indebtedness |
|
|
Total Facility Size |
|
|
Maturity Date |
||
|
Warehouse lines of credit |
|
$ |
442,593 |
|
|
800,000(1) |
|
|
January 2021 |
|
|
|
|
|
148,011 |
|
|
|
250,000 |
|
|
September 2021 |
|
|
|
|
541,074 |
|
|
700,000(2) |
|
|
February 2021 |
|
|
|
|
|
187,214 |
|
|
|
200,000 |
|
|
May 2021 |
|
|
|
|
232,272 |
|
|
|
300,000 |
|
|
September 2021 |
|
|
|
|
464,355 |
|
|
500,000(3) |
|
|
July 2021 |
|
|
|
|
|
104,880 |
|
|
|
200,000 |
|
|
April 2021 |
|
Early buyout facility |
|
|
25,185 |
|
|
|
75,000 |
|
|
March 2024(4) |
|
MSR notes payable |
|
|
80,750 |
|
|
150,000(5) |
|
|
September 2022 |
|
|
|
|
|
45,000 |
|
|
200,000(6) |
|
|
June 2022 |
|
|
|
|
|
20,000 |
|
|
|
65,000 |
|
|
July 2021 |
|
(1) |
Subsequent to December 31, 2020, this facility was amended with a maturity date of 30 days from written notice by either the financial institution or the Company. |
|
(2) |
Subsequent to December 31, 2020, this facility was reduced to $500.0 million and amended with a maturity date of February 2022. |
|
(3) |
Amounts drawn on the MSR notes payable with this lender reduce the facility size available under the warehouse line of credit with this lender by an equal and offsetting amount. |
|
(4) |
Each buyout transaction carries a maximum term of four years from the date of repurchase. |
|
(5) |
Facility provides for committed amount of $100.0 million, which can be increased up to $150.0 million. |
|
(6) |
Facility provides for committed amount of $135.0 million, which can be increased up to $200.0 million. |
The investors to whom we sell mortgage loans we originate in the secondary market require us to abide by certain operating and financial covenants. These covenants include maintaining (i) a certain minimum net worth, (ii) a certain minimum liquidity, (iii) a certain minimum of total liquid assets, (iv) a certain maximum ratio of adjusted net worth to total assets and (v) fidelity bond and mortgage servicing errors and omissions coverage. A breach of these covenants could result in an event of default and could disallow us to continue selling mortgage loans to one or all of these investors in the secondary market which, in turn, could have a significant impact on our liquidity and results of operations. We believe we were in compliance with all of these covenants as of December 31, 2020 and December 31, 2019.
When we sell loans in the secondary market, we have the option to sell them service released or service retained. The decision whether to sell a loan that we originated service released or service retained is based on factors such as execution and price, liquidity needs and the desire to retain the related client relationship. When we sell a loan service retained, we continue to act as the servicer for the life of the loan. We rely on income from loan servicing and other fees over the life of the loan to generate cash. Certain investors have different rules for the servicer to follow should a loan go into default. As the servicer, we may be legally obligated to make cash payments to the investor who purchased the loan, should the borrower discontinue making payments on the loan. This could have a negative impact to our cash and liquidity; however, we may be able to use other borrower prepayments to cover delinquencies. Should delinquencies significantly increase, or prepayments significantly decrease, we could be forced to use our own cash or borrow on other types of financing in order to make the required monthly payments to the investors who have purchased loans from us. We may also be contractually required to repurchase or indemnify loans with origination defects.
Cash Flows
Our cash flows for the years ended December 31, 2020 and December 31, 2019 are summarized below.
|
|
|
Years Ended December 31, |
|
|||||
|
($ in thousands) |
|
2020 |
|
|
2019 |
|
||
|
Net cash used in operating activities |
|
$ |
(468,041 |
) |
|
$ |
(424,707 |
) |
|
Net cash used in investing activities |
|
|
(18,025 |
) |
|
|
(13,488 |
) |
|
Net cash provided by financing activities |
|
|
718,964 |
|
|
|
482,175 |
|
|
Net increase in cash, cash equivalents and restricted cash |
|
$ |
232,898 |
|
|
$ |
43,980 |
|
38
Operating activities
Our cash flows from operating activities are primarily influenced by changes in the levels of inventory of loans held for sale, as shown below.
|
|
|
Years Ended December 31, |
|
|||||
|
($ in thousands) |
|
2020 |
|
|
2019 |
|
||
|
Loans held for sale |
|
$ |
(807,852 |
) |
|
$ |
(533,610 |
) |
|
Other operating sources |
|
|
339,811 |
|
|
|
108,903 |
|
|
Net cash used in operating activities |
|
$ |
(468,041 |
) |
|
$ |
(424,707 |
) |
Cash used in operating activities increased for the year ended December 31, 2020 compared to the prior year period, consistent with the increase in loan origination volume for the same time period. The increase in cash used for loans held for sale was partially offset by cash provided by other operating sources, which was primarily due to an increase in the projected duration of the cash flows to be earned with respect to our MSRs.
Investing activities
Our investing activities primarily consist of purchases of property and equipment and acquisitions. Cash used in investing activities increased for the year ended December 31, 2020 compared to the prior year period, which was primarily due to $8.2 million invested in leasehold improvements, equipment and technology upgrades, and $9.8 million used for certain payments made to Guild Mortgage Company LLC’s parent entity prior to our restructuring and IPO.
Financing activities
Our cash flows from financing activities are primarily influenced by changes in the levels of warehouse lines of credit used to fund loan originations, which were consistent with the increase in loan origination volume.
|
|
|
Years Ended December 31, |
|
|||||
|
|
|
2020 |
|
|
2019 |
|
||
|
($ in thousands) |
|
|
|
|
|
|
|
|
|
Warehouse lines of credit |
|
$ |
841,178 |
|
|
$ |
463,453 |
|
|
Other financing sources |
|
|
(122,214 |
) |
|
|
18,722 |
|
|
Net cash provided by financing activities |
|
$ |
718,964 |
|
|
$ |
482,175 |
|
Cash provided by other financing sources decreased for the year ended December 31, 2020 compared to the prior year period, which was primarily driven by the increase in repayments on our MSR notes payable of $110.0 million and a decrease in borrowings on our MSR notes payable of $20.0 million.
Balance Sheet Analysis
The following is a summary of key balance sheet items as of the dates presented.
|
|
|
December 31, 2020 |
|
|
December 31, 2019 |
|
||
|
($ in thousands) |
|
|
|
|
|
|
|
|
|
Assets |
|
|
|
|
|
|
|
|
|
Cash, cash equivalents and restricted cash |
|
$ |
339,633 |
|
|
$ |
106,735 |
|
|
Mortgage loans held for sale |
|
|
2,368,777 |
|
|
|
1,504,842 |
|
|
Mortgage servicing rights, net |
|
|
446,998 |
|
|
|
418,402 |
|
|
GNMA loans subject to repurchase right |
|
|
1,275,842 |
|
|
|
404,344 |
|
|
Other |
|
|
386,837 |
|
|
|
173,090 |
|
|
Total assets |
|
$ |
4,818,087 |
|
|
$ |
2,607,413 |
|
|
Liabilities and Stockholders' Equity |
|
|
|
|
|
|
|
|
|
Warehouse lines of credit |
|
$ |
2,143,443 |
|
|
$ |
1,303,187 |
|
|
Notes payable |
|
|
145,750 |
|
|
|
218,000 |
|
|
GNMA loans subject to repurchase right |
|
|
1,277,026 |
|
|
|
412,490 |
|
|
Deferred tax liability |
|
|
89,370 |
|
|
|
86,278 |
|
|
Other |
|
|
426,506 |
|
|
|
181,427 |
|
|
Total liabilities |
|
|
4,082,095 |
|
|
|
2,201,382 |
|
|
Stockholders' equity |
|
|
735,992 |
|
|
|
406,031 |
|
|
Total liabilities and stockholders' equity |
|
$ |
4,818,087 |
|
|
$ |
2,607,413 |
|
December 31, 2020 and 2019
Total assets increased by $2.2 billion from $2.6 billion as of December 31, 2019 to $4.8 billion as of December 31, 2020. This increase was primarily due to the increase in MLHS of $0.9 billion and the increase in GNMA loans for which we have repurchase rights of $0.9 billion. The increase in MLHS was the result of an increase in our origination volume of 113.4% for December 2020 compared to December 2019. The increase in our inventory of loans for which we have repurchase rights resulted from increased delinquency on loans in forbearance under the CARES Act. As of December 31, 2020, approximately $0.9 billion of our inventory of loans for which we have repurchase rights was related to loans in forbearance under the CARES Act.
39
Total liabilities increased by $1.9 billion from $2.2 billion as of December 31, 2019 to $4.1 billion as of December 31, 2020. This increase was primarily due to a $0.8 billion increase in the balances under our warehouse lines of credit and a $0.9 billion increase in GNMA loans for which we have repurchase rights. This $0.9 billion increase in GNMA loans for which we have repurchase rights resulted from increased delinquency on loans in forbearance under the CARES Act. The increase of 64.5% in the balances under our warehouse lines of credit resulted from the increase in our origination volume in December 2020 compared to December 2019.
Contractual Obligations
Repurchase and indemnification obligations
In the ordinary course of business, we are exposed to liability with respect to certain representations and warranties that we make to the investors who purchase the loans that we originate. Under certain circumstances, we may be required to repurchase mortgage loans, or indemnify the purchaser of such loans for losses incurred, if there has been a breach of these representations and warranties, or in the case of early payment defaults. In addition, in the event of an early payment default, we are contractually obligated to refund certain premiums paid to us by the investors who purchased the related loan. See Note 17, Commitments and Contingencies to the consolidated financial statements included in Item 8.
Interest rate lock commitments, loan sale and forward commitments
We enter into IRLCs with clients who have applied for residential mortgage loans and who meet certain credit and underwriting criteria. These commitments expose us to market risk if interest rates change during the period of time in which the loan is not economically hedged or committed to be sold to an investor. We are also exposed to credit loss if a loan for which we entered into an IRLC is originated and is not sold to an investor and the related client does not perform. The collateral upon extension of credit typically consists of a first deed of trust in the mortgagor’s residential property. Commitments to originate loans do not necessarily reflect future cash requirements as some commitments are expected to expire without being drawn upon. Total commitments to originate loans, adjusted for pull-through, were approximately $4.5 billion and $1.5 billion as of December 31, 2020 and December 31, 2019, respectively.
Critical Accounting Policies
The preparation of our financial statements in conformity with GAAP requires management to make certain estimates and assumptions that affect the reported amounts of assets and liabilities and disclosure of contingent assets and liabilities at the date of the financial statements and the reported amounts of revenues and expenses during the reporting period. Certain of these estimates significantly influence the portrayal of our financial condition and results, and they require us to make difficult, subjective or complex judgments. Although we believe that the judgments, estimates and assumptions used in the preparation of our consolidated financial statements were appropriate given the circumstances at the time they were made, actual results could materially differ from those estimates. Our critical accounting policies primarily relate to the fair value estimates of our MLHS, MSRs, IRLCs and forward delivery commitments. See Note 2, Fair Value Measurements to the consolidated financial statements included in Item 8 for additional information. Below is a summary of our assets recorded at fair value compared to our total assets and stockholders’ equity as of December 31, 2020 and 2019.
|
|
|
December 31, 2020 |
|
|
December 31, 2019 |
|
||||||||||||||||||
|
|
|
|
|
|
|
Percentage of |
|
|
|
|
|
|
Percentage of |
|
||||||||||
|
Level/Description ($ in thousands) |
|
Carrying Value of Assets |
|
|
Total Assets |
|
|
Stockholders' Equity |
|
|
Carrying Value of Assets |
|
|
Total Assets |
|
|
Stockholders' Equity |
|
||||||
|
Level One: Prices determined using quote prices in active markets for identical assets or liabilities |
|
$ |
78 |
|
|
|
0 |
% |
|
|
0 |
% |
|
$ |
93 |
|
|
|
0 |
% |
|
|
0 |
% |
|
Level Two: Prices determined using other significant observable inputs that other market participants would use in pricing an asset or liability and are developed based on market data obtained from sources independent of us. |
|
|
2,368,777 |
|
|
|
49 |
% |
|
|
322 |
% |
|
|
1,504,842 |
|
|
|
58 |
% |
|
|
371 |
% |
|
Level Three: Prices determined using significant unobservable inputs that reflect our judgements about the factors that market participants use in pricing an asset or liability and are based on the best information available in the circumstances. |
|
|
577,336 |
|
|
|
12 |
% |
|
|
78 |
% |
|
|
438,324 |
|
|
|
17 |
% |
|
|
108 |
% |
|
Total assets measured at or based on fair value |
|
|
2,946,191 |
|
|
|
61 |
% |
|
|
400 |
% |
|
|
1,943,259 |
|
|
|
75 |
% |
|
|
479 |
% |
|
Total assets |
|
|
4,818,087 |
|
|
|
|
|
|
|
|
|
|
|
2,607,413 |
|
|
|
|
|
|
|
|
|
|
Total stockholders' equity |
|
$ |
735,992 |
|
|
|
|
|
|
|
|
|
|
$ |
406,031 |
|
|
|
|
|
|
|
|
|
As shown above, our consolidated balance sheet is substantially comprised of assets and liabilities that are measured at or based on their fair values. The decreases in the percentage of assets carried at fair value compared to total assets from 2019 to 2020 is due to the increase in GNMA loans subject to repurchase right at December 31,
40
2020. These loans, which are not measured at fair value, increased $871.5 million over December 31, 2019. Changes in the inputs used to measure the fair value of these assets can have significant effects on their reported balances.
As a result of the difficulty in observing certain significant inputs affecting our fair value assets and liabilities, we are required to make subjective judgments regarding the fair values of these items. Different persons in possession of the same facts may reasonably arrive at different conclusions as to the inputs used in valuing these assets and liabilities and their fair values. Such differences may result in significantly different fair value measurements. Likewise, due to the general illiquidity of some of these assets, subsequent transactions with respect to them may be at values significantly different from those we record.
Due to the difficulty and complexity in measuring certain of our fair value assets and liabilities, we engage third parties to assist management in determining their values. We have also established controls in which management reviews and discusses these valuations with our accounting department and any third parties that we have engaged for this purpose to ensure accuracy over financial reporting. We re-measure the fair value of these assets and liabilities on a monthly or quarterly basis by evaluating certain observable information, which may include current market pricing, recent trade activity, and industry data.
Mortgage Loans Held for Sale
MLHS are classified within “Level Two” of the valuation hierarchy because we determine their fair value based on secondary market pricing for loans with similar characteristics. We determine the fair value of our MLHS based on either: (i) the fair value of securities backed by similar mortgage loans, adjusted for certain other factors, including credit risk and the value attributable to the related servicing rights, (ii) our investors’ current commitments to purchase loans or (iii) recent observable market trades for similar loans, adjusted for credit risk and other individual loan characteristics.
Mortgage Servicing Rights
MSRs are classified within Level Three of the valuation hierarchy because we determine their fair value based on unobservable inputs and because there is no active market for MSRs. To determine the fair value of our MSRs when they are created, we use our valuation model that calculates the present value of the future cash flows related to them. Our MSR valuation model incorporates assumptions that market participants would use in estimating future net servicing income, including estimates of contractual service fees, ancillary income and late fees, the cost of servicing, the discount rate, float value, the inflation rate, estimated prepayment speeds and default rates. A third party conducts a monthly valuation of our MSRs, and we record any changes to the fair value of our MSRs that result from changes in valuation model inputs or assumptions and collections of servicing cash flows in accordance with such third-party analysis and GAAP. Changes in economic and other relevant conditions could cause the assumptions used in valuing our MSRs, such as those with respect to prepayment speeds, to be incorrect and such changes could result in fluctuations in the recorded value of our MSRs.
Derivative Instruments
IRLCs are classified within Level Three of the valuation hierarchy because we determine their value based upon unobservable inputs and because there is no active market for IRLCs. We determine the fair value of our IRLCs based upon the estimated fair value of the underlying mortgage loan, including the expected net future cash flows related to servicing that mortgage loan, net of estimated incentive compensation, and adjusted for: (i) estimated costs to complete and originate the loan and (ii) an adjustment to reflect the estimated percentage of IRLCs that will result in a closed mortgage loan under the original terms of the agreement (the “pull-through rate”). We estimate the pull-through rate based on changes in pricing and actual borrower behavior using a historical analysis of loan closing data and “fallout” data with respect to the number of commitments that have historically remained unexercised.
Forward delivery commitments
Forward delivery commitments are classified within Level Two of the valuation hierarchy. We determine the fair value of our forward delivery commitments based upon the current agency mortgage-backed security market TBA pricing specific to the related loan program, delivery coupon and delivery date of the trade. We also enter into best efforts sales commitments for certain loans at the time the borrower commitment is made. These best-efforts sales commitments are valued by comparing the committed price to the counterparty against the current market price of the IRLC or MLHS.
Recent Accounting Pronouncements
See Note 1 – Business, Basis of Presentation, and Accounting Policies to the consolidated financial statements included in Item 8 in this Annual Report for a discussion of recent accounting developments and their expected effects on Guild.
ITEM 7A. QUANTITATIVE AND QUALITATIVE DISCLOSURE ABOUT MARKET RISK
As a smaller reporting company, we are not required to provide information for this item.
41
ITEM 8. FINANCIAL STATEMENTS AND SUPPLEMENTARY DATA
Report of Independent Registered Public Accounting Firm
To the Stockholders and Board of Directors
Guild Holdings Company:
Opinion on the Consolidated Financial Statements
We have audited the accompanying consolidated balance sheets of Guild Holdings Company and subsidiaries (the Company) as of December 31, 2020 and 2019, the related consolidated statements of income, changes in stockholders’ equity, and cash flows for each of the years in the two‑year period ended December 31, 2020, and the related notes (collectively, the consolidated financial statements). In our opinion, the consolidated financial statements present fairly, in all material respects, the financial position of the Company as of December 31, 2020 and 2019, and the results of its operations and its cash flows for each of the years in the two‑year period ended December 31, 2020, in conformity with U.S. generally accepted accounting principles.
Basis for Opinion
These consolidated financial statements are the responsibility of the Company’s management. Our responsibility is to express an opinion on these consolidated financial statements based on our audits. We are a public accounting firm registered with the Public Company Accounting Oversight Board (United States) (PCAOB) and are required to be independent with respect to the Company in accordance with the U.S. federal securities laws and the applicable rules and regulations of the Securities and Exchange Commission and the PCAOB.
We conducted our audits in accordance with the standards of the PCAOB. Those standards require that we plan and perform the audit to obtain reasonable assurance about whether the consolidated financial statements are free of material misstatement, whether due to error or fraud. The Company is not required to have, nor were we engaged to perform, an audit of its internal control over financial reporting. As part of our audits, we are required to obtain an understanding of internal control over financial reporting but not for the purpose of expressing an opinion on the effectiveness of the Company’s internal control over financial reporting. Accordingly, we express no such opinion.
Our audits included performing procedures to assess the risks of material misstatement of the consolidated financial statements, whether due to error or fraud, and performing procedures that respond to those risks. Such procedures included examining, on a test basis, evidence regarding the amounts and disclosures in the consolidated financial statements. Our audits also included evaluating the accounting principles used and significant estimates made by management, as well as evaluating the overall presentation of the consolidated financial statements. We believe that our audits provide a reasonable basis for our opinion.
Critical Audit Matter
The critical audit matter communicated below is a matter arising from the current period audit of the consolidated financial statements that was communicated or required to be communicated to the audit committee and that: (1) relates to accounts or disclosures that are material to the consolidated financial statements and (2) involved our especially challenging, subjective, or complex judgments. The communication of a critical audit matter does not alter in any way our opinion on the consolidated financial statements, taken as a whole, and we are not, by communicating the critical audit matter below, providing separate opinions on the critical audit matter or on the accounts or disclosures to which it relates.
Fair value of Mortgage Servicing Rights
As discussed in Note 1, Note 2, and Note 7 to the consolidated financial statements, the fair value of mortgage servicing rights (MSRs) as of December 31, 2020 is $447.0. The Company recognizes MSRs when loans are sold, and the associated servicing rights are retained. The Company maintains one class of MSR asset and has elected the fair value method with the changes in fair value being recorded in current period income. To determine the fair value of the mortgage servicing right, the Company uses a third-party valuation firm and its valuation model that calculates the present value of future cash flows. The valuation model incorporates assumptions that market participants would use in estimating future net servicing income, including estimates of contractual service fees, ancillary income and late fees, the cost of servicing, float value, the inflation rate, estimated prepayment speeds, and default rates. These estimated cash flows are present valued using a discount rate which is reflective of the Company's required return on capital in addition to a premium for market liquidity, funding cost, and operational risk.
We identified the assessment of the valuation of MSRs as a critical audit matter. A high degree of audit effort, including specialized skills and knowledge, and subjective and complex auditor judgment was involved in assessing the estimated fair value of the MSRs. Specifically, the assessment encompassed the evaluation of the MSR methodology, including the methods and models used to estimate the following key assumptions because they are unobservable and the sensitivity of changes to those assumptions have a significant effect on the valuation: (1) estimated prepayment speeds, (2) the cost of servicing, and (3) the discount rate. There was also a high degree of subjectivity and potential for management bias related to updates made to key assumptions due to changes in market conditions, mortgage interest rates, and servicing standards.
42
The following are the primary procedures we performed to address this critical audit matter. We evaluated the design and implementation of an internal control related to the Company's determination of the estimated fair value of the MSRs, including a control over the assessment of the key assumptions and evaluation of the fair value of the MSRs through comparison to independent third-party valuations. We evaluated the Company's process to develop the fair value of the MSRs by testing certain sources of data and assumptions. In addition, we involved valuation professionals with specialized skills and knowledge who assisted in:
|
|
• |
assessing the design of the valuation model used to estimate the fair value of the MSRs in accordance with relevant U.S. generally accepted accounting principles |
|
|
• |
evaluating the third-party valuation specialist, which included (1) assessing their professional qualifications to determine that the specialist possesses the appropriate knowledge, skills and ability, (2) obtaining an understanding of the nature of the work performed, and (3) evaluating the relationship of the specialist to the Company |
|
|
• |
evaluating the Company's valuation of MSRs by (1) benchmarking the value to comparable entities using industry surveys and (2) performing trend analyses with market data |
|
|
• |
assessing the key assumptions by benchmarking against ranges obtained from comparable entities and industry surveys |
|
|
• |
evaluating estimated prepayment speeds by analyzing backtesting results for the assumption |
|
|
• |
evaluating the MSR fair value by comparing it against a MSR fair value range that was independently developed using market data for comparable entities. |
/s/ KPMG LLP
We have served as the Company’s auditor since 2013.
Irvine, California
March 23, 2021
43
GUILD HOLDINGS COMPANY
CONSOLIDATED BALANCE SHEETS
As of December 31, 2020 and 2019
(In thousands, except share and per share amounts)
|
|
|
December 31, 2020 |
|
|
December 31, 2019 |
|
||
|
Assets |
|
|
|
|
|
|
|
|
|
Cash and cash equivalents |
|
$ |
|
|
|
$ |
|
|
|
Restricted cash |
|
|
|
|
|
|
|
|
|
Mortgage loans held for sale |
|
|
|
|
|
|
|
|
|
Ginnie Mae loans subject to repurchase right |
|
|
|
|
|
|
|
|
|
Accounts and interest receivable |
|
|
|
|
|
|
|
|
|
Derivative asset |
|
|
|
|
|
|
|
|
|
Mortgage servicing rights, net |
|
|
|
|
|
|
|
|
|
Goodwill |
|
|
|
|
|
|
|
|
|
Other assets |
|
|
|
|
|
|
|
|
|
Total assets |
|
$ |
|
|
|
$ |
|
|
|
Liabilities and Stockholders’ Equity |
|
|
|
|
|
|
|
|
|
Warehouse lines of credit |
|
$ |
|
|
|
$ |
|
|
|
Notes payable |
|
|
|
|
|
|
|
|
|
Ginnie Mae loans subject to repurchase right |
|
|
|
|
|
|
|
|
|
Accounts payable and accrued expenses |
|
|
|
|
|
|
|
|
|
Accrued compensation and benefits |
|
|
|
|
|
|
|
|
|
Investor reserves |
|
|
|
|
|
|
|
|
|
Income taxes payable |
|
|
|
|
|
|
— |
|
|
Due to parent company |
|
|
— |
|
|
|
|
|
|
Contingent liabilities due to acquisitions |
|
|
|
|
|
|
|
|
|
Derivative liability |
|
|
|
|
|
|
|
|
|
Operating lease liabilities |
|
|
|
|
|
|
— |
|
|
Note due to related party |
|
|
|
|
|
|
|
|
|
Deferred compensation plan |
|
|
|
|
|
|
|
|
|
Deferred tax liability |
|
|
|
|
|
|
|
|
|
Total liabilities |
|
|
|
|
|
|
|
|
|
Commitments and contingencies (Note 17) |
|
|
|
|
|
|
|
|
|
Stockholders’ Equity |
|
|
|
|
|
|
|
|
|
Preferred stock, $ issued and outstanding |
|
|
|
|
|
|
|
|
|
Common stock, $ outstanding at December 31, 2019 |
|
|
— |
|
|
|
|
|
|
Class A common stock, $ |
|
|
|
|
|
|
— |
|
|
Class B common stock, $ |
|
|
|
|
|
|
— |
|
|
Additional paid-in capital |
|
|
|
|
|
|
|
|
|
Retained earnings |
|
|
|
|
|
|
|
|
|
Total stockholders’ equity |
|
|
|
|
|
|
|
|
|
Total Liabilities and Stockholders’ Equity |
|
$ |
|
|
|
$ |
|
|
See accompanying notes to consolidated financial statements
44
GUILD HOLDINGS COMPANY
CONSOLIDATED STATEMENTS OF INCOME
For the Years Ended December 31, 2020 and 2019
(In thousands, except per share amounts)
|
|
|
2020 |
|
|
2019 |
|
||
|
Revenue |
|
|
|
|
|
|
|
|
|
Loan origination fees and gain on sale of loans, net |
|
$ |
|
|
|
$ |
|
|
|
Loan servicing and other fees |
|
|
|
|
|
|
|
|
|
Valuation adjustment of mortgage servicing rights |
|
|
( |
) |
|
|
( |
) |
|
Interest income |
|
|
|
|
|
|
|
|
|
Interest expense |
|
|
( |
) |
|
|
( |
) |
|
Other income, net |
|
|
|
|
|
|
|
|
|
Net revenue |
|
|
|
|
|
|
|
|
|
Expenses |
|
|
|
|
|
|
|
|
|
Salaries, incentive compensation and benefits |
|
|
|
|
|
|
|
|
|
General and administrative |
|
|
|
|
|
|
|
|
|
Occupancy, equipment and communication |
|
|
|
|
|
|
|
|
|
Depreciation and amortization |
|
|
|
|
|
|
|
|
|
Provision for foreclosure losses |
|
|
|
|
|
|
|
|
|
Total expenses |
|
|
|
|
|
|
|
|
|
Income before income tax expense |
|
|
|
|
|
|
|
|
|
Income tax expense |
|
|
|
|
|
|
|
|
|
Net income |
|
$ |
|
|
|
$ |
|
|
|
Net income per share attributable to Class A and Class B Common Stock: |
|
|
|
|
|
|
|
|
|
Basic |
|
$ |
|
|
|
|
|
|
|
Diluted |
|
$ |
|
|
|
|
|
|
|
Weighted average shares outstanding of Class A and Class B Common Stock: |
|
|
|
|
|
|
|
|
|
Basic |
|
|
|
|
|
|
|
|
|
Diluted |
|
|
|
|
|
|
|
|
See accompanying notes to consolidated financial statements
45
GUILD HOLDINGS COMPANY
CONSOLIDATED STATEMENTS OF CHANGES IN STOCKHOLDERS’ EQUITY
For the Years Ended December 31, 2020 and 2019
(In thousands, except share and per share amounts)
|
|
|
Class A Shares |
|
|
Class A Amount |
|
|
Class B Shares |
|
|
Class B Amount |
|
|
Shares |
|
|
Amount |
|
|
Additional Paid-In Capital |
|
|
Retained Earnings |
|
|
Total |
|
|||||||||
|
Balance at December 31, 2018 |
|
|
— |
|
|
$ |
— |
|
|
|
— |
|
|
$ |
— |
|
|
|
|
|
|
$ |
|
|
|
$ |
|
|
|
$ |
|
|
|
$ |
|
|
|
Common stock dividends ($ |
|
|
— |
|
|
|
— |
|
|
|
— |
|
|
|
— |
|
|
|
— |
|
|
|
— |
|
|
|
— |
|
|
|
( |
) |
|
|
( |
) |
|
Stock repurchase |
|
|
— |
|
|
|
— |
|
|
|
— |
|
|
|
— |
|
|
|
( |
) |
|
|
( |
) |
|
|
( |
) |
|
|
( |
) |
|
|
( |
) |
|
Net income |
|
|
— |
|
|
|
— |
|
|
|
— |
|
|
|
— |
|
|
|
— |
|
|
|
— |
|
|
|
— |
|
|
|
|
|
|
|
|
|
|
Balance at December 31, 2019 |
|
|
— |
|
|
$ |
— |
|
|
|
— |
|
|
$ |
— |
|
|
|
|
|
|
$ |
|
|
|
$ |
|
|
|
$ |
|
|
|
$ |
|
|
|
Common stock dividends ($ |
|
|
— |
|
|
|
— |
|
|
|
— |
|
|
|
— |
|
|
|
— |
|
|
|
— |
|
|
|
— |
|
|
|
( |
) |
|
|
( |
) |
|
Effect of reorganization transactions |
|
|
— |
|
|
|
— |
|
|
|
— |
|
|
|
— |
|
|
|
( |
) |
|
|
( |
) |
|
|
|
|
|
|
— |
|
|
|
— |
|
|
Issuance of common stock |
|
|
|
|
|
|
|
|
|
|
|
|
|
|
|
|
— |
|
|
|
— |
|
|
|
( |
) |
|
|
— |
|
|
|
— |
|
||
|
Conversion of Class B common stock |
|
|
|
|
|
|
|
|
|
( |
) |
|
|
( |
) |
|
|
|
|
|
|
|
|
|
|
— |
|
|
|
— |
|
|
|
— |
|
|
|
Offering costs |
|
|
— |
|
|
|
— |
|
|
|
— |
|
|
|
— |
|
|
|
— |
|
|
|
— |
|
|
|
( |
) |
|
|
— |
|
|
|
( |
) |
|
Stock-based compensation |
|
|
— |
|
|
|
— |
|
|
|
— |
|
|
|
— |
|
|
|
— |
|
|
|
— |
|
|
|
|
|
|
|
— |
|
|
|
|
|
|
Net income |
|
|
— |
|
|
|
— |
|
|
|
— |
|
|
|
— |
|
|
|
— |
|
|
|
— |
|
|
|
— |
|
|
|
|
|
|
|
|
|
|
Balance at December 31, 2020 |
|
|
|
|
|
$ |
|
|
|
|
|
|
|
$ |
|
|
|
|
|
|
|
$ |
— |
|
|
$ |
|
|
|
$ |
|
|
|
$ |
|
|
See accompanying notes to consolidated financial statements
46
GUILD HOLDINGS COMPANY
CONSOLIDATED STATEMENTS OF CASH FLOWS
For the Years Ended December 31, 2020 and 2019
(In thousands)
|
|
|
2020 |
|
|
2019 |
|
||
|
Cash flows from operating activities |
|
|
|
|
|
|
|
|
|
Net income |
|
$ |
|
|
|
$ |
|
|
|
Adjustments to reconcile net income to net cash used in operating activities: |
|
|
|
|
|
|
|
|
|
Depreciation and amortization of fixed assets |
|
|
|
|
|
|
|
|
|
Valuation adjustment of mortgage servicing rights |
|
|
|
|
|
|
|
|
|
Valuation adjustment of mortgage loans held for sale |
|
|
( |
) |
|
|
( |
) |
|
Unrealized gain on derivatives |
|
|
( |
) |
|
|
( |
) |
|
Amortization of right-of-use assets |
|
|
|
|
|
|
— |
|
|
Provision for investor reserves |
|
|
|
|
|
|
|
|
|
Provision for foreclosure losses |
|
|
|
|
|
|
|
|
|
Valuation adjustment of contingent liabilities due to acquisitions |
|
|
|
|
|
|
|
|
|
Gain on sale of mortgage loans excluding fair value of other financial instruments, net |
|
|
( |
) |
|
|
( |
) |
|
Deferred income taxes |
|
|
|
|
|
|
( |
) |
|
Other |
|
|
|
|
|
|
|
|
|
Benefit from investor reserves |
|
|
( |
) |
|
|
( |
) |
|
Foreclosure loss reserve |
|
|
( |
) |
|
|
( |
) |
|
Stock-based compensation |
|
|
|
|
|
|
— |
|
|
Changes in operating assets and liabilities: |
|
|
|
|
|
|
|
|
|
Origination of mortgage loans held for sale |
|
|
( |
) |
|
|
( |
) |
|
Proceeds on sale of and payments from mortgage loans held for sale |
|
|
|
|
|
|
|
|
|
Accounts and interest receivable |
|
|
( |
) |
|
|
( |
) |
|
Other assets |
|
|
( |
) |
|
|
|
|
|
Mortgage servicing rights |
|
|
( |
) |
|
|
( |
) |
|
Accounts payable and accrued expenses |
|
|
|
|
|
|
|
|
|
Accrued compensation and benefits |
|
|
|
|
|
|
|
|
|
Income taxes |
|
|
|
|
|
|
— |
|
|
Contingent liability payments |
|
|
( |
) |
|
|
( |
) |
|
Operating lease liabilities |
|
|
( |
) |
|
|
— |
|
|
Deferred compensation plan liability |
|
|
|
|
|
|
( |
) |
|
Proceeds from real estate owned conveyed to HUD |
|
|
|
|
|
|
|
|
|
Purchase and advances of real estate owned |
|
|
( |
) |
|
|
( |
) |
|
Net cash used in operating activities |
|
|
( |
) |
|
|
( |
) |
|
Cash flows from investing activities |
|
|
|
|
|
|
|
|
|
Proceeds from the sale of property & equipment |
|
|
|
|
|
|
|
|
|
Purchase of property and equipment |
|
|
( |
) |
|
|
( |
) |
|
Payment made on behalf of affiliate |
|
|
( |
) |
|
|
( |
) |
|
Acquisitions |
|
|
— |
|
|
|
( |
) |
|
Net cash used in investing activities |
|
|
( |
) |
|
|
( |
) |
|
Cash flows from financing activities |
|
|
|
|
|
|
|
|
|
Borrowings on warehouse lines of credit |
|
|
|
|
|
|
|
|
|
Repayments on warehouse lines of credit |
|
|
( |
) |
|
|
( |
) |
|
Borrowings on MSR notes payable |
|
|
|
|
|
|
|
|
|
Repayments on MSR notes payable |
|
|
( |
) |
|
|
( |
) |
|
Contingent liability payments |
|
|
( |
) |
|
|
( |
) |
|
Net change in notes payable |
|
|
( |
) |
|
|
|
|
|
Repurchase of stock |
|
|
— |
|
|
|
( |
) |
|
Payment of offering costs |
|
|
( |
) |
|
|
— |
|
|
Dividends paid |
|
|
( |
) |
|
|
( |
) |
|
Net cash provided by financing activities |
|
|
|
|
|
|
|
|
|
Increase in cash, cash equivalents and restricted cash |
|
|
|
|
|
|
|
|
|
Cash, cash equivalents and restricted cash, beginning of year |
|
|
|
|
|
|
|
|
|
Cash, cash equivalents and restricted cash, end of year |
|
$ |
|
|
|
$ |
|
|
|
Supplemental information |
|
|
|
|
|
|
|
|
|
Net cash paid for interest |
|
$ |
|
|
|
$ |
|
|
|
Net cash paid for taxes |
|
$ |
|
|
|
$ |
|
|
|
Net assets acquired due to acquisition |
|
$ |
— |
|
|
$ |
|
|
|
Non-Cash disclosures (See Note 20) |
|
|
|
|
|
|
|
|
See accompanying notes to consolidated financial statements
47
GUILD HOLDINGS COMPANY
NOTES TO CONSOLIDATED FINANCIAL STATEMENTS
(Dollars in thousands, except as otherwise indicated)
NOTE 1 - BUSINESS, BASIS OF PRESENTATION, AND ACCOUNTING POLICIES
Organization
Guild Holdings Company (the “Company”, and together with its consolidated subsidiaries, “Guild”, “we”, “us”, “our”) was incorporated in Delaware on August 11, 2020 for the purpose of facilitating an initial public offering (“IPO”) of its Class A common stock and other related transactions in order to carry on the business of Guild Mortgage Company LLC (“GMC”) and its wholly owned subsidiaries. GMC was incorporated in California on August 10, 1960 and in October of 2020 was converted to a California limited liability company.
The Company originates, sells, and services residential mortgage loans. The Company operates approximately
The Company is certified with the United States Department of Housing and Urban Development (“HUD”) and the Department of Veterans Affairs (“VA”) and operates as a Federal Housing Association (“FHA”) non-supervised lender. In addition, the Company is an approved issuer with Government National Mortgage Association (“GNMA”), as well as an approved seller and servicer with Federal National Mortgage Association (“FNMA”), the Federal Home Loan Mortgage Corporation (“FHLMC”) and the United States Department of Agriculture Rural Development (“USDA”).
Properties securing the mortgage loans in the Company’s servicing portfolio are geographically dispersed throughout the United States; however, at December 31, 2020, approximately
IPO and Reorganization
In October 2020 the Company underwent a reorganization in connection with its initial public offering (the “Offering” or “IPO”). Prior to the completion of the Offering, GMC’s former parent entity, Guild Investors, LLC, contributed
As a result of the IPO and the reorganization:
|
|
● |
Guild Holdings Company is the sole management member of GMC, which owns a direct interest in its subsidiaries. |
|
|
● |
Guild Holdings Company is a holding company which has no material assets, other than its ownership of GMC, and its indirect interest in the subsidiaries of GMC and has no independent means of generating revenue or cash flow. |
|
|
● |
|
|
|
● |
|
|
|
● |
The public stockholders own |
Principles of Consolidation
The Company has
Use of Estimates
The preparation of financial statements in conformity with accounting principles generally accepted in the United States of America (“GAAP”) requires management to make estimates and assumptions that affect the reported amounts of assets and liabilities and disclosure of contingent assets and liabilities at the date of the financial statements and the reported amounts of revenues and expenses during the reporting period. Actual results could materially differ from those estimates.
48
In March 2020, the World Health Organization (“WHO”) declared the outbreak of a novel coronavirus (“COVID-19”) as a pandemic, which continues to spread throughout the United States. The Company remains fully functional in both its origination and servicing operations. While the pandemic could cause certain branches to temporarily close, most of the significant job functions can be performed remotely. The Company has taken steps to ensure business can continue as necessary should branches be forced to temporarily close. The Company continues to monitor guidance published by the WHO, Centers for Disease Control and Prevention, local and federal government agencies and the Mortgage Bankers Association and is in continual communication with its investors regarding the developments in the mortgage industry.
Revenue Recognition
Loan origination fees and gain on sale of loans, net — loan origination fees and gain on sale of loans, net includes all components related to the origination and sale of mortgage loans, including (1) net gain on sale of loans, which represents the premium the Company receives in excess of the loan principal amount and certain fees charged by investors upon sale of loans into the secondary market, (2) loan origination fees (credits), points and certain costs, (3) provision for or benefit from investor reserves, (4) the change in fair value of interest rate locks and loans held for sale, (5) the gain or loss on forward commitments hedging loans held for sale and interest rate lock commitments (“IRLCs”), and (6) the fair value of originated mortgage servicing rights (“MSRs”). An estimate of the gain on sale of loans, net is recognized at the time an IRLC is issued, net of a pull-through factor. Subsequent changes in the fair value of IRLCs and mortgage loans held for sale are recognized in current period earnings. When the mortgage loan is sold into the secondary market, any difference between the proceeds received and the current fair value of the loan is recognized in current period earnings. Included in gain on sale of loans, net is the fair value of originated MSRs, which represents the estimated fair value of MSRs related to loans which we have sold and retained the right to service. See Note 1 sections; Mortgage Loans Held for Sale, Mortgage Servicing Rights and Derivative Instruments, for more information related to fair value measurements of mortgage loans held for sale, the gain/(loss) on changes in the fair value of MSRs and the gain/(loss) on changes in the fair value of IRLCs, respectively. At December 31, 2020 and 2019, loan origination fees and gain on sale of loans were net of direct expenses of $
Loan servicing and other fees — Loan servicing fees represent fees earned for servicing loans for various investors. The servicing fees are based on a contractual percentage of the outstanding principal balance and recognized into revenue as the related mortgage payments are received. Loan servicing expenses are charged to operations as incurred.
Valuation adjustment of mortgage servicing rights — In accordance with Accounting Standards Codification (“ASC”) 860-50, the Company records MSRs as an asset, at fair value. The change in fair value is recorded within the Consolidated Statements of Income on a monthly basis. See Note 1, Mortgage Servicing Rights, for information related to the gain/(loss) on changes in the fair value of MSRs.
Interest income — interest income includes interest earned on mortgage loans held for sale
Interest expense — interest expense includes interest paid to the Company’s loan funding facilities and MSR facilities.
Cash, Cash Equivalents and Restricted Cash
For cash flow purposes, the Company considers cash and temporary investments with original maturities of three months or less, to be cash and cash equivalents. The Company typically maintains cash in financial institutions in excess of Federal Deposit Insurance Corporation limits. The Company evaluates the creditworthiness of these financial institutions in determining the risk associated with these cash balances. The Company maintains cash balances that are restricted under the terms of its warehouse lines of credit.
The following table summarizes the Company’s cash, cash equivalents and restricted cash at December 31, 2020 and 2019:
|
|
|
2020 |
|
|
2019 |
|
||
|
Cash and cash equivalents |
|
$ |
|
|
|
$ |
|
|
|
Restricted cash |
|
|
|
|
|
|
|
|
|
Total cash, cash equivalents and restricted cash shown in the Consolidated Statements of Cash Flows |
|
$ |
|
|
|
$ |
|
|
Mortgage Loans Held for Sale
The Company measures newly originated prime residential Mortgage Loans Held for Sale (“MLHS”) at fair value in accordance with ASC 825, Financial Instruments. Included in mortgage loans held for sale are loans originated as held for sale that are expected to be sold into the secondary market and loans that have been previously sold and repurchased from investors that management intends to resell into the secondary market, which are recorded at fair value.
The Company estimates fair value by evaluating a variety of market indicators, including recent trades and outstanding commitments, calculated on an individual loan basis and aggregated (see Note 2 — Fair Value Measurements). Changes in the fair value of mortgage loans are recognized in current period income and are included in loan origination fees and gain on sale of loans, net. Fair value for mortgage loans covered by investor commitments is based on commitment prices. Fair value for uncommitted loans is based on current delivery prices. The Company is not permitted to defer the loan origination fees, net of direct loan origination costs associated with these loans.
49
Loans are considered sold when the Company surrenders control over the financial assets. Control is considered to have been surrendered when the transferred assets have been isolated from the Company, beyond the reach of the Company and its creditors; the purchaser obtains the right (free of conditions that constrain it from taking advantage of that right) to pledge or exchange the transferred assets; and the Company does not maintain effective control over the transferred assets through an agreement that both entitles and obligates the Company to repurchase or redeem the transferred assets before their maturity. The Company typically considers the above criteria to have been met upon acceptance and receipt of sales proceeds from the purchaser.
Ginnie Mae Loans Subject to Repurchase Right
In accordance with ASC 860-50, Transfers and Servicing — Servicing Assets and Liabilities (“ASC 860-50”), certain loans, as defined by the servicer guidelines, serviced by the Company on behalf of GNMA are recognized as an asset, and carried at the unpaid principal balance (“UPB”) of the loans. The Company has a right to repurchase any loans serviced on behalf of GNMA that are three or more consecutive payments delinquent (“GNMA Loan Inventory”). The Company recognizes a corresponding liability (“GNMA Loan Payable”) which is recorded at the unpaid principal balance, for loans in which the Company has not exercised the right to repurchase the loans. If the loan goes through foreclosure and is an FHA loan, HUD acts as the insurer for GNMA and reimburses the servicer for the UPB plus allowable interest and foreclosure fees. The Company reserves for unreimbursed interest and fees as part of the general foreclosure reserve. If the loan goes through foreclosure and is a VA loan, the VA acts as the insurer and reimburses the Company based on the net value of the underlying property. At the amount determined by the VA, the Company accounts for any loss on VA loans in its foreclosure loss reserve to a certain threshold with any excess charged to its investor reserves. If a foreclosure sale has been held on an FHA loan, the deed is transferred to the Company and the loan becomes a GNMA real estate owned (“REO”). These are foreclosed real estate properties securing GNMA loans. Both principal and interest for government insured/guaranteed loans secured by the foreclosed real estate properties are collectible because the loans are insured by the FHA or guaranteed by the VA. The GNMA Loan Inventory and real estate owned is equal, and offsetting, to the GNMA Loan Payable.
Mortgage Servicing Rights
Mortgage servicing rights are recognized as assets in the Consolidated Balance Sheet when loans are sold, and the associated servicing rights are retained. The Company maintains one class of MSR asset and has elected the fair value option. To determine the fair value of the servicing right when created, the Company uses a valuation model that calculates the present value of future cash flows. The valuation model incorporates assumptions that market participants would use in estimating future net servicing income, including estimates of contractual service fees, ancillary income and late fees, the cost of servicing, the discount rate, float value, the inflation rate, estimated prepayment speeds, and default rates.
Derivative Instruments
The Company enters into IRLCs, forward commitments to sell mortgage loans and to be announced trades which are considered derivative financial instruments. These items are accounted for as free-standing derivatives and are included in the Consolidated Balance Sheets at fair value. The Company treats all of its derivative instruments as economic hedges; therefore, none of its derivative instruments qualify for designation as accounting hedges.
The Company enters into IRLCs to originate residential mortgage loans at specified interest rates and within a specified period of time, with customers who have applied for a loan and meet certain credit and underwriting criteria. IRLCs on mortgage loans in process that have not closed, but are intended to be sold, are considered to be derivatives and changes in fair value are recorded in the Consolidated Statements of Income as part of Loan Origination Fees and Gain on Sale of Loans, net. Fair value is based upon changes in the fair value of the underlying mortgages, estimated to be realizable upon sale into the secondary market, net of estimated incentive compensation expenses. Fair value estimates also consider loan commitments not expected to be exercised by customers for unforeseen reasons, commonly referred to as fallout.
IRLCs and uncommitted mortgage loans held for sale expose the Company to the risk that the value of the mortgage loans held and mortgage loans underlying the commitments may decline due to increases in mortgage interest rates during the life of the commitments. To protect against this risk the Company enters into derivative loan instruments such as forward loan sales commitments, mandatory delivery commitments, options and futures contracts. Management expects the changes in the fair value of these derivatives to have a negative correlation to the changes in fair value of the derivative loan commitments and loans held for sale, thereby reducing earnings volatility. The changes in fair value are recorded in the Consolidated Statements of Income as part of Loan Origination Fees and Gain on Sale of Loans, net. The Company considers various factors and strategies in determining the portion of the mortgage pipeline and loans held for sale it wants to economically hedge.
Forward commitments include To-Be-Announced (“TBA”) mortgage-backed securities that have been aggregated at the counterparty level for presentation and disclosure purposes. Counterparty agreements contain a legal right to offset amounts due to and from the same counterparty under legally enforceable master netting agreements to settle with the same counterparty, on a net basis, as well as the right to obtain cash collateral. Forward commitments also include commitments to sell loans to counterparties and to purchase loans from counterparties at determined prices. See Notes 2 and 6 for additional information.
Property and Equipment
Property and equipment is recorded at cost and depreciated using the straight-line method over the estimated useful life of the asset, usually
50
The Company recognizes internal-use software within property and equipment which consists of both internal and external costs incurred in the development, testing and implementation directly related to the new software. The internal-use software is amortized over a period and begins amortization upon the “go-live” date of the software. The Company determines the “go-live” date as the date in which the software is readily available to be used companywide.
Acquisitions
When making an acquisition, the Company recognizes separately from goodwill the assets acquired and the liabilities assumed at their acquisition date fair values under ASC 805, Business Combinations. Goodwill as of the acquisition date is measured as the excess of consideration transferred and the net of the acquisition date fair values of the assets acquired and the liabilities assumed. The Company uses its best estimates and assumptions to accurately value assets acquired and liabilities assumed at the acquisition date. The Company’s estimates are inherently uncertain and actual results may differ from expectations. The Company may record measurement period adjustments during the measurement period (one year from the acquisition date) that result from obtaining additional information about the facts and circumstances that existed as of the acquisition date. If this additional information had been known, it would have affected the accounting for the business combination as of the acquisition date.
Accounting for business combinations requires the Company’s management to make estimates and assumptions, especially at the acquisition date with respect to mortgage servicing rights and contingent considerations. Although the Company believes the assumptions and estimates it has made in the past have been reasonable and appropriate, they are based in part on historical experience and information obtained from the management of the acquired companies and are inherently uncertain.
Goodwill
Goodwill is recorded at fair value and is tested for potential impairment at least annually, or whenever events or changes in circumstances indicate that the carrying value may not be recoverable.
The Company’s goodwill is allocated by reporting unit and is evaluated for impairment by first performing a qualitative assessment to determine whether a quantitative goodwill test is necessary. Qualitative factors include, among other things, macroeconomic conditions, industry and market considerations, financial performance of the respective reporting unit and other relevant entity- and reporting-unit specific considerations. If it is determined, based on qualitative factors, that the fair value of the reporting unit may be more likely than not less than the carrying amount, or if significant adverse changes in our future financial performance occur that could materially impact fair value, a quantitative goodwill impairment test would be required.
The fair value of goodwill is determined by assigning the fair value of the reporting unit to all the assets and liabilities of that unit as if the reporting unit had been acquired in a business combination. If the fair value is less than the carrying value, the amount of impairment expense is equal to the difference between the reporting unit’s fair value and the reporting unit’s carrying value. See Note 10 – Goodwill for further information.
Contingent Liabilities due to Acquisitions
The Company may be required to pay future consideration to the former shareholders of acquired companies, depending upon the terms of the applicable purchase agreement, which is contingent upon the achievement of certain financial and operating targets. The Company determines the fair value for its contingent consideration obligations using an income approach whereby the Company forecasts the cash outflows related to the earn-outs, which are based on a percentage of net income specified in the purchase agreements. The Company then discounts these expected payment amounts to calculate the fair value as of the valuation date. The Company’s management evaluates the underlying projections used in determining fair value each period and makes updates to these underlying projections when there have been significant changes in management’s expectations of the future business performance.
The principal significant unobservable input used in the valuations of the Company’s contingent consideration obligations is a risk-adjusted discount rate. Whereas management’s underlying projections adjust for market penetration and other economic expectations, the discount rate is risk-adjusted for key factors such as uncertainty in the mortgage banking industry due to its reliance on external influences (interest rates, regulatory changes, etc.), upfront payments, and credit risk. An increase in the discount rate will result in a decrease in the fair value of contingent consideration. Conversely, a decrease in the discount rate will result in an increase in the fair value of contingent consideration.
At each reporting date, or whenever there are significant changes in underlying key assumptions, a review of these assumptions is performed and the contingent consideration liability is updated to its estimated fair value. If there are no significant changes in the assumptions, the quarterly determination of the fair value of contingent consideration reflects the implied interest for the passage of time. Changes in the estimated fair value of the contingent consideration obligations may result from changes in the terms of the contingent payments, changes in discount periods and rates and changes in probability assumptions with respect to the timing and likelihood of achieving the certain financial targets. Actual progress toward achieving the financial targets for the remaining measurement periods may be different than the Company’s expectations of future performance. The change in the estimated fair value of contingent consideration is included in general and administrative expense in the Consolidated Statements of Income.
51
Real Estate Owned
There are
The second type is foreclosed real estate securing GNMA loans in process of conveyance to HUD but insured by FHA, where the Company is the controller of the deed for a period of time. For GNMA loans, the property becomes REO if not sold to a third party at its foreclosure sale. Both principal and debenture rate interest for government insured loans secured by the foreclosed real estate are collectible because the loans are insured by FHA. This is valued at the UPB of the loan, which is considered to be fair value, as HUD reimburses the Company for the UPB plus debenture rate interest and fees. The Company reserves for unreimbursed interest in excess of the debenture rate and fees as part of the foreclosure loss reserve. The total REO property that will be conveyed to HUD was valued at $
Investor Reserves
The Company has exposure to potential mortgage loan repurchases and indemnifications in its capacity as a loan originator and servicer. The estimation of the liability for probable losses related to the repurchase and indemnification obligation considers an estimate of probable future repurchase or indemnification obligations from breaches of representations and warranties. The liability related to specific non-performing loans is based on a loan-level analysis considering the current collateral value, estimated sales proceeds and selling costs. The liability related to probable future repurchase or indemnification obligations is segregated by year of origination and considers the amount of unresolved repurchase and indemnification requests, as well as an estimate of future repurchase demands. Future repurchase demands are estimated based upon recent and historical repurchase and indemnification experience, as well as the success rate in appealing repurchase requests and an estimated loss severity, based on current loss rates for similar loans. The Company also has exposure to early payment defaults (“EPD”) and/or early payoff fees (“EPO”). When the Company sells a loan to an investor and the loan either pays off or goes into default within a certain timeframe, the Company could be exposed to EPD and/or EPO fees in accordance with each investor’s contract. The Company reserves for these fees by estimating early payment defaults and fees based on prior loan activity and current loan origination volume.
Foreclosure Loss Reserve and Provision for Foreclosure Losses
The Company has exposure for losses associated with government loans in foreclosure related to nonrefundable interest and foreclosure servicing costs. The Company maintains a reserve for government loans currently in foreclosure based on historical loss experience. The Company also accrues for any additional known losses above the current loss per loan; for example, losses due to servicer delays.
Advertising
Advertising is expensed as incurred and amounted to $
Stock-Based Compensation
Stock-based compensation expense is measured at the grant date based on the fair value of the award and is recognized as an expense on a straight-line basis over the requisite service period, which is generally the vesting period. The fair value of restricted stock units (“RSUs”) is based on the value of the Company’s common stock on the date of grant. Stock-based compensation is included in salaries, incentive compensation and benefits. See Note 16 for additional information.
Earnings Per Share
The Company determines earnings per share in accordance with the authoritative guidance in ASC Topic 260, Earnings Per Share. Basic earnings per share is computed by dividing the net income available to common stockholders for the period by the weighted average number of common shares outstanding during the period using the two-class method. Diluted earnings per share is computed in the same manner as basic earnings per share, except that the number of shares is increased to assume the issuance of potentially dilutive shares using the treasury stock method, unless the effect of such increase would be anti-dilutive. Under the treasury stock method, the average amount of compensation cost for future service that the Company has not yet recognized is assumed to be used to repurchase shares.
Offering Costs
The Company complies with the requirements of SEC Staff Accounting Bulletin Topic 5A — “Expenses of Offering.” Offering costs consist principally of professional and registration fees incurred through the balance sheet date that are related to our IPO and were charged to stockholders’ equity upon the completion. Accordingly, offering costs totaling $
52
Income Taxes
Income taxes are accounted for under the asset and liability method. Deferred tax assets and liabilities are recognized for the future tax consequences attributable to differences between the financial statement carrying amounts of existing assets and liabilities and their respective tax bases and operating loss and tax credit carryforwards. Deferred tax assets and liabilities are measured using enacted tax rates expected to apply to taxable income in the years in which those temporary differences are expected to be recovered or settled. The effect on deferred tax assets and liabilities of a change in tax rates is recognized in income in the period that includes the enactment date. The Company recognizes the effect of income tax positions only if those positions are more-likely than-not to be sustained. Recognized income tax positions are measured at the largest amount that is greater than 50% likely of being realized. Changes in recognition or measurement are reflected in the period in which the change in judgment occurs. The Company records interest related to unrecognized tax benefits in interest expense and records penalties as a component of income taxes.
Escrow and Fiduciary Funds
As a loan servicer, the Company maintains segregated bank accounts in trust for investors and escrow balances for mortgagors, which are excluded from the Company’s Consolidated Balance Sheets. These accounts totaled $
Risks and Uncertainties
In the normal course of business, companies in the mortgage banking industry encounter certain economic, liquidity, and regulatory risks.
Economic risk includes interest rate risk and credit risk.
Interest rate risk
The Company’s mortgage loans held for sale, commitments to originate loans, and mortgage servicing rights are subject to interest rate risk. For mortgage loans held for sale and commitments to originate loans, to the extent that a rising interest rate environment exists, the Company may experience a decrease in loan production and decreases in value, which may negatively impact the Company’s operations. To mitigate this risk the Company uses hedging strategies designed to ensure any fluctuations in rates would not have a material impact on the Company’s financial position. For the Company’s mortgage servicing rights, to the extent that a declining interest rate environment exists, the Company may experience decreases in the fair value of the portfolio, which may negatively impact the Company’s financial position. For the years ended December 31, 2020 and 2019, the Company experienced a material decline in the valuation of its MSR portfolio due to a significant decline in interest rates. Since the Company also has a large origination platform the Company was able to mitigate this risk by recapturing a significant portion of the runoff through refinances.
Credit risk
Credit risk is the risk of default that may result from borrowers’ inability or unwillingness to make contractually required payments during the period in which loans are being held for sale. The Company considers credit risk associated with these loans to be insignificant as it holds the loans for a short period of time, typically less than a month, and historically the Company has not experienced any material losses due to credit risk on loans held for sale.
The Company sells loans to investors without recourse. As such, the investors have assumed the risk of loss or default by the borrower. However, the Company is usually required by these investors to make certain standard representations and warranties relating to credit information, loan documentation and collateral. To the extent that the Company does not comply with such representations, or there are early payment defaults, the Company may be required to repurchase the loans or indemnify these investors for any losses from borrower defaults, defects in the collateral or errors made in the credit decision.
The Company is also subject to counterparty credit risk in the event of contractual nonperformance by its trading counterparties to its various over-the-counter derivative financial instruments. The Company manages this credit risk by selecting only counterparties that it believes to be financially strong, spreading the credit risk among many such counterparties, placing contractual limits on the amount of unsecured credit extended to any single counterparty, and entering into netting agreements with the counterparties as appropriate. The master netting agreements contain a legal right to offset amounts due to and from the same counterparty. Derivative assets in the Consolidated Balance Sheets represent derivative contracts in a gain position net of loss positions with the same counterparty and, therefore, also represent the Company’s maximum counterparty credit risk. The Company incurred
Liquidity risk
The Company encounters liquidity risk as the business requires substantial cash to support its operating activities. As a result, the Company is dependent on its lines of credit, and other financing facilities in order to finance its continued operations. If the Company’s principal lenders decided to terminate or not to renew these credit facilities with the Company, the loss of borrowing capacity could have an adverse impact on the Company’s financial statements unless the Company found a suitable alternative source. To mitigate this risk, the Company has multiple financing facilities with different lenders and varied maturity dates. Historically, the Company has not had a line of credit involuntarily terminated by a lender.
53
Regulatory risk
The Company is subject to extensive and comprehensive regulation under federal, state and local laws in the United States. These laws and regulations significantly affect the way in which the Company does business and can restrict the scope of the Company’s existing business and limit the Company’s ability to expand product offerings or pursue acquisitions, or can make costs to service or originate loans higher, which could impact financial results. The Company continually monitors its regulatory environment for any changes that could have a significant impact on operations.
Recently Adopted Accounting Pronouncements
In February 2016, the Financial Accounting Standards Board (“FASB”) issued ASU 2016-02, Leases (Topic 842), which has been subsequently amended by ASUs 2018-01, 2018-10, 2018-11, 2018-20, 2019-01 and 2019-10. This guidance amends various aspects of existing guidance for leases and requires additional disclosures about leasing arrangements. It will require companies to recognize lease assets and lease liabilities by lessees for those leases classified as operating leases under previous GAAP. Topic 842 retains a distinction between finance leases and operating leases. The classification criteria for distinguishing between finance leases and operating leases are substantially similar to the classification criteria for distinguishing between capital leases and operating leases in the previous lease guidance. Effective December 31, 2020, we lost our emerging growth company (“EGC”) status which accelerated the adoption of Topic 842. On January 1, 2020, the Company adopted ASU 2016-02. The Company adopted the new guidance using the modified retrospective transition approach by applying the new standard to all leases existing at the date of initial application and not restating comparative periods. The most significant impact was the recognition of right-of-use assets and lease liabilities for operating leases. See Note 9 for further information on our implementation of this standard.
In June 2016, the FASB issued ASU 2016-13, Financial Instruments — Credit Losses (Topic 326). This update requires expected credit losses for financial instruments held at the reporting date to be measured based on historical experience, current conditions and reasonable and supportable forecasts. The update eliminates the probable initial recognition threshold in current GAAP and instead reflects an entity’s current estimate of all expected credit losses. Previously, when credit losses were measured under GAAP, an entity generally only considered past events and current conditions in measuring the incurred loss. In November 2019, the FASB issued ASU 2019-10 which extended the effective date of ASU 2016-13. On January 1, 2020, the Company adopted ASU 2016-13. The adoption did not have a material impact on our financial statements as the Company’s primary financial instruments impacted by the ASU are measured at fair value. For financial instruments not measured at fair value the Company determined that either due to the assets’ relatively short-term lives or the fact that the assets’ credit-related losses are minimized due to guarantees from the Federal Housing Administration or Veterans Affairs it limits the Company’s exposure to potential credit-related losses to an immaterial amount.
Accounting Standards Issued but Not Yet Adopted
Prior to December 31, 2020, as an EGC, we elected to use the extended transition period provided by the Jumpstart Our Business Startups Act for the implementation of new or revised accounting standards. Effective December 31, 2020, we lost our EGC status. The adoption dates discussed below reflect adoption dates based on our revised filing status as a smaller reporting company.
In August 2018, the FASB issued ASU 2018-15, Intangibles-Goodwill and Other-Internal-Use Software (Subtopic 35-40). This update provides guidance on accounting for a cloud computing arrangement that includes a license to internal-use software. This generally means that an intangible asset is recognized for the software license and, to the extent that the payments attributable to the software license are made over time, a liability also is recognized. If a cloud computing arrangement does not include a software license, the entity should account for the arrangement as a service contract which would generally mean to expense the service as incurred. The new guidance will be effective for the Company beginning January 1, 2021 and early adoption is permitted. The Company is currently in the process of evaluating the impact of the adoption of the new guidance on its financial statements.
In December 2019, the FASB issued ASU 2019-12, Income Taxes (Topic 740). This update provides amendments to simplify and reduce complexity when accounting for income taxes as well as eliminating certain exceptions. The new guidance will be effective for the Company beginning January 1, 2022 with early adoption permitted. The Company is currently in the process of evaluating the impact of the adoption of the new guidance on its financial statements.
In March 2020, the FASB issued ASU No. 2020-04, Reference Rate Reform (Topic 848): Facilitation of the Effects of Reference Rate Reform on Financial Reporting, which provides optional guidance for a limited period of time to ease the potential burden in accounting for (or recognizing the benefits of) reference rate reform on financial reporting. The amendments in ASU 2020-04 are elective and apply to all entities, subject to meeting certain criteria, that have contract, hedging relationships, and other transactions that reference London Interbank Offered Rate (“LIBOR”) or another reference rate expected to be discontinued because of reference rate reform. This guidance is effective upon issuance and allows application to contract changes as early as January 1, 2020. The Company is in the process of reviewing its funding facilities and financing facilities that utilize LIBOR as the reference rate and is currently evaluating the potential impact that the adoption of this ASU will have on its financial statements and related disclosures.
In August 2020, the FASB issued ASU 2020-06, Debt — Debt with Conversion and Other Options (Subtopic 470-20) and Derivatives and Hedging — Contracts in Entity’s Own Equity (Subtopic 815-40): Accounting for Convertible Instruments and Contracts in an Entity’s Own Equity, which simplifies the accounting for convertible instruments by reducing the number of accounting models available for convertible debt instruments. This guidance also eliminates the treasury stock method to calculate diluted earnings per share for convertible instruments and requires the use of the if-converted method. The new guidance will be effective for the Company beginning January
54
1, 2024, and interim periods within those fiscal years. Early adoption is permitted. The Company is currently in the process of evaluating the impact of the adoption of the new guidance on its financial statements.
NOTE 2 - FAIR VALUE MEASUREMENTS
Fair value is defined as the exchange price that would be received for an asset or paid to transfer a liability (an exit price) in the principal or most advantageous market for the asset or liability in an orderly transaction between market participants at the measurement date. Inputs used to measure fair value are prioritized within a three-level fair value hierarchy. This hierarchy requires entities to maximize the use of observable inputs and minimize the use of unobservable inputs. The categorization of assets and liabilities measured at fair value within the valuation hierarchy is based on the lowest level of input that is significant to the fair value measurement. The three levels of inputs used to measure fair value are as follows:
|
|
• |
Level One - Level One inputs are unadjusted, quoted prices in active markets for identical assets or liabilities which the Company has the ability to access at the measurement date. |
|
|
• |
Level Two - Level Two inputs are observable for that asset or liability, either directly or indirectly, and include quoted prices for similar assets and liabilities in active markets, quoted prices for identical or similar assets and liabilities in markets that are not active, observable inputs for the asset or liability other than quoted prices and inputs derived principally from or corroborated by observable market data by correlation or other means. If the asset or liability has a specified contractual term, the inputs must be observable for substantially the full term of the asset or liability. |
|
|
• |
Level Three - Level Three inputs are unobservable inputs for the asset or liability that reflect the Company’s assessment of the assumptions that market participants would use in pricing the asset or liability, including assumptions about risk, and are developed based on the best information available. |
The Company updates the valuation of each instrument recorded at fair value on a monthly or quarterly basis, evaluating all available observable information which may include current market prices or bids, recent trade activity, changes in the levels of market activity and benchmarking of industry data. The assessment also includes consideration of identifying the valuation approach that would be used currently by market participants. If it is determined that a change in valuation technique or its application is appropriate, or if there are other changes in availability of observable data or market activity, the current methodology will be analyzed to determine if a transfer between levels of the valuation hierarchy is appropriate. Such reclassifications are reported as transfers into or out of a level as of the beginning of the quarter that the change occurs.
Fair value is based on quoted market prices, when available. If quoted prices are not available, fair value is estimated based upon other observable inputs. Unobservable inputs are used when observable inputs are not available and are based upon judgments and assumptions, which are the Company’s assessment of the assumptions market participants would use in pricing the asset or liability. These inputs may include assumptions about risk, counterparty credit quality, the Company’s creditworthiness and liquidity and are developed based on the best information available. When a determination is made to classify an asset or liability within Level Three of the valuation hierarchy, the determination is based upon the significance of the unobservable factors to the overall fair value measurement of the asset or liability. The fair value of assets and liabilities classified within Level Three of the valuation hierarchy also typically includes observable factors and the realized or unrealized gain or loss recorded from the valuation of these instruments would also include amounts determined by observable factors.
Recurring Fair Value Measurements
The Company’s fair value measurements are evaluated within the fair value hierarchy, based on the nature of the inputs used to determine the fair value at the measurement date. At December 31, 2020 and 2019, the Company had the following assets and liabilities that are measured at fair value on a recurring basis:
Trading Securities — Trading securities are classified within Level One of the valuation hierarchy. Valuation is based upon quoted prices for identical instruments traded in active markets. Level One trading securities include securities traded on active exchange markets, such as the New York Stock Exchange. Trading securities are included within prepaid expenses and other assets in the Consolidated Balance Sheets.
Derivative Instruments — Derivative instruments are classified within Level Two and Level Three of the valuation hierarchy, and include the following:
Interest Rate Lock Commitments: IRLCs are classified within Level Three of the valuation hierarchy. IRLCs represent an agreement to extend credit to a mortgage loan applicant, or an agreement to purchase a loan from a third-party originator, whereby the interest rate on the loan is set prior to funding. The fair value of IRLCs is based upon the estimated fair value of the underlying mortgage loan, including the expected net future cash flows related to servicing the mortgage loan, net of estimated incentive compensation expenses, and adjusted for: (i) estimated costs to complete and originate the loan and (ii) an adjustment to reflect the estimated percentage of IRLCs that will result in a closed mortgage loan under the original terms of the agreement (pull-through rate). The pull-through rate is considered a significant unobservable input and is estimated based on changes in pricing and actual borrower behavior using a historical analysis of loan closing and fallout data. The average pull-through rate used to calculate the fair value of IRLCs as of December 31, 2020 and 2019, was
Forward Delivery Commitments: Forward delivery commitments are classified within Level Two of the valuation hierarchy. Forward delivery commitments fix the forward sales price that will be realized upon the sale of mortgage loans into the secondary market. The fair value of forward delivery commitments is primarily based upon the current agency mortgage-backed security market to-be-announced pricing specific to the loan program, delivery coupon and delivery date of the trade. Best efforts sales commitments are also entered into
55
for certain loans at the time the borrower commitment is made. These best-efforts sales commitments are valued using the committed price to the counterparty against the current market price of the IRLC or mortgage loan held for sale.
Option contracts are a type of forward commitment that represents the rights to buy or sell mortgage-backed securities at specified prices in the future. Their value is based upon the underlying current to-be-announced pricing of the agency mortgage-backed security market, and market-based volatility. See Note 6 for additional information on the derivative instruments.
Mortgage Loans Held for Sale — MLHS are carried at fair value. The fair value of MLHS is based on secondary market pricing for loans with similar characteristics, and as such, is classified as a Level Two measurement. For Level Two MLHS, fair value is estimated through a market approach by using either: (i) the fair value of securities backed by similar mortgage loans, adjusted for certain factors to approximate the fair value of a whole mortgage loan, including the value attributable to servicing rights and credit risk, (ii) current commitments to purchase loans or (iii) recent observable market trades for similar loans, adjusted for credit risk and other individual loan characteristics. The agency mortgage-backed security market is a highly liquid and active secondary market for conforming conventional loans whereby quoted prices exist for securities at the pass-through level and are published on a regular basis. The Company has the ability to access this market and it is the market into which conforming mortgage loans are typically sold.
Mortgage Servicing Rights — MSRs are classified within Level Three of the valuation hierarchy due to the use of significant unobservable inputs and the lack of an active market for such assets. The fair value of MSRs is estimated based upon projections of expected future cash flows considering prepayment estimates, the Company’s historical prepayment rates, portfolio characteristics, interest rates based on interest rate yield curves, implied volatility, costs to service and other economic factors. The Company obtains valuations from an independent third party on a monthly basis, and records an adjustment based on this third-party valuation.
Contingent Liabilities due to acquisitions — Contingent liabilities represent future obligations of the Company to make payments to the former owners of its acquired companies. The Company determines the fair value of its contingent liabilities using a discounted cash flow approach whereby the Company forecasts the cash outflows related to the future payments, which are based on a percentage of net income specified in the purchase agreements. The Company then discounts these expected payment amounts to calculate the present value, or fair value, as of the valuation date. The Company’s management evaluates the underlying projections used in determining fair value each period and makes updates to these underlying projections.
The Company uses a risk-adjusted discount rate to value the contingent liabilities which is considered a significant unobservable input, and as such, the liabilities are classified as a Level Three measurement. Management’s underlying projections adjust for market penetration and other economic expectations, and the discount rate is risk-adjusted for key factors such as uncertainty in the mortgage banking industry due to its reliance on external influences (interest rates, regulatory changes, etc.), upfront payments, and credit risk. An increase in the discount rate will result in a decrease in the fair value of the contingent liabilities. Conversely, a decrease in the discount rate will result in an increase in the fair value of the contingent liabilities. For each of the years ended December 31, 2020 and 2019, the range of the risk adjusted discount rate was
The following table summarizes the Company’s assets and liabilities measured at fair value on a recurring basis at December 31, 2020:
|
Description |
|
Level 1 |
|
|
Level 2 |
|
|
Level 3 |
|
|
Total |
|
||||
|
Assets: |
|
|
|
|
|
|
|
|
|
|
|
|
|
|
|
|
|
Trading securities |
|
$ |
|
|
|
$ |
— |
|
|
$ |
— |
|
|
$ |
|
|
|
Derivative |
|
|
|
|
|
|
|
|
|
|
|
|
|
|
|
|
|
Interest rate lock commitments |
|
|
— |
|
|
|
— |
|
|
|
|
|
|
|
|
|
|
Mortgage loans held for sale |
|
|
— |
|
|
|
|
|
|
|
— |
|
|
|
|
|
|
Mortgage servicing rights |
|
|
— |
|
|
|
— |
|
|
|
|
|
|
|
|
|
|
Total assets at fair value |
|
$ |
|
|
|
$ |
|
|
|
$ |
|
|
|
$ |
|
|
|
Liabilities: |
|
|
|
|
|
|
|
|
|
|
|
|
|
|
|
|
|
Derivative |
|
|
|
|
|
|
|
|
|
|
|
|
|
|
|
|
|
Forward delivery commitments |
|
$ |
— |
|
|
$ |
|
|
|
$ |
— |
|
|
$ |
|
|
|
Contingent liabilities due to acquisitions |
|
|
— |
|
|
|
— |
|
|
|
|
|
|
|
|
|
|
Total liabilities at fair value |
|
$ |
— |
|
|
$ |
|
|
|
$ |
|
|
|
$ |
|
|
56
The following table summarizes the Company’s assets and liabilities measured at fair value on a recurring basis at December 31, 2019:
|
Description |
|
Level 1 |
|
|
Level 2 |
|
|
Level 3 |
|
|
Total |
|
||||
|
Assets: |
|
|
|
|
|
|
|
|
|
|
|
|
|
|
|
|
|
Trading securities |
|
$ |
|
|
|
$ |
— |
|
|
$ |
— |
|
|
$ |
|
|
|
Derivative |
|
|
|
|
|
|
|
|
|
|
|
|
|
|
|
|
|
Interest rate lock commitments |
|
|
— |
|
|
|
— |
|
|
|
|
|
|
|
|
|
|
Mortgage loans held for sale |
|
|
— |
|
|
|
|
|
|
|
— |
|
|
|
|
|
|
Mortgage servicing rights |
|
|
— |
|
|
|
— |
|
|
|
|
|
|
|
|
|
|
Total assets at fair value |
|
$ |
|
|
|
$ |
|
|
|
$ |
|
|
|
$ |
|
|
|
Liabilities: |
|
|
|
|
|
|
|
|
|
|
|
|
|
|
|
|
|
Derivative |
|
|
|
|
|
|
|
|
|
|
|
|
|
|
|
|
|
Forward delivery commitments |
|
$ |
— |
|
|
$ |
|
|
|
$ |
— |
|
|
$ |
|
|
|
Contingent liabilities due to acquisitions |
|
|
— |
|
|
|
— |
|
|
|
|
|
|
|
|
|
|
Total liabilities at fair value |
|
$ |
— |
|
|
$ |
|
|
|
$ |
|
|
|
$ |
|
|
The table below presents a reconciliation of Level 3 assets and liabilities measured at fair value on a recurring basis for the years ended:
|
|
|
IRLCs |
|
|
Contingent Liabilities |
|
||
|
Balance at December 31, 2018 |
|
$ |
|
|
|
$ |
|
|
|
Net transfers and revaluation gains |
|
|
|
|
|
|
— |
|
|
Payments |
|
|
— |
|
|
|
( |
) |
|
Additions |
|
|
— |
|
|
|
|
|
|
Valuation adjustments |
|
|
— |
|
|
|
|
|
|
Balance at December 31, 2019 |
|
$ |
|
|
|
$ |
|
|
|
Net transfers and revaluation gains |
|
|
|
|
|
|
— |
|
|
Payments |
|
|
— |
|
|
|
( |
) |
|
Valuation adjustments |
|
|
— |
|
|
|
|
|
|
Balance at December 31, 2020 |
|
$ |
|
|
|
$ |
|
|
Changes in the availability of observable inputs may result in reclassifications of certain assets or liabilities. Such reclassifications are reported as transfers in or out of Level Three as of the beginning of the period that the change occurs. There were no transfers between fair value levels during the years ended December 31, 2020 and 2019.
Non-Recurring Fair Value Measurements
Certain assets and liabilities that are not typically measured at fair value on a recurring basis may be subject to fair value measurement requirements under certain circumstances. These adjustments to fair value usually result from write-downs of individual assets. At December 31, 2020 and 2019, the Company had the following financial assets measured at fair value on a nonrecurring basis:
Ginnie Mae Loans subject to Repurchase Right — GNMA securitization programs allow servicers to buy back individual delinquent mortgage loans from the securitized loan pool once certain conditions are met.
The following table summarizes the Company’s financial assets measured at fair value on a nonrecurring basis at December 31, 2020:
|
Description |
|
Level 1 |
|
|
Level 2 |
|
|
Level 3 |
|
|
Total |
|
||||
|
Assets: |
|
|
|
|
|
|
|
|
|
|
|
|
|
|
|
|
|
Ginnie Mae loans subject to repurchase right |
|
$ |
— |
|
|
$ |
|
|
|
$ |
— |
|
|
$ |
|
|
|
Total assets at fair value |
|
$ |
— |
|
|
$ |
|
|
|
$ |
— |
|
|
$ |
|
|
|
Liabilities: |
|
|
|
|
|
|
|
|
|
|
|
|
|
|
|
|
|
Ginnie Mae loans subject to repurchase right |
|
$ |
— |
|
|
$ |
|
|
|
$ |
— |
|
|
$ |
|
|
|
Total liabilities at fair value |
|
$ |
— |
|
|
$ |
|
|
|
$ |
— |
|
|
$ |
|
|
The following table summarizes the Company’s financial assets measured at fair value on a nonrecurring basis at December 31, 2019:
57
|
Description |
|
Level 1 |
|
|
Level 2 |
|
|
Level 3 |
|
|
Total |
|
||||
|
Assets: |
|
|
|
|
|
|
|
|
|
|
|
|
|
|
|
|
|
Ginnie Mae loans subject to repurchase right |
|
$ |
— |
|
|
$ |
|
|
|
$ |
— |
|
|
$ |
|
|
|
Total assets at fair value |
|
$ |
— |
|
|
$ |
|
|
|
$ |
— |
|
|
$ |
|
|
|
Liabilities: |
|
|
|
|
|
|
|
|
|
|
|
|
|
|
|
|
|
Ginnie Mae loans subject to repurchase right |
|
$ |
— |
|
|
$ |
|
|
|
$ |
— |
|
|
$ |
|
|
|
Total liabilities at fair value |
|
$ |
— |
|
|
$ |
|
|
|
$ |
— |
|
|
$ |
|
|
Fair Value Option
The following is the estimated fair value and unpaid principal balance of MLHS that have contractual principal amounts and for which the Company has elected the fair value option. The fair value option was elected for MLHS as the Company believes fair value best reflects their expected future economic performance:
|
|
|
Fair Value |
|
|
Principal Amount Due Upon Maturity |
|
|
Difference (1) |
|
|||
|
Balance at December 31, 2020 |
|
$ |
|
|
|
$ |
|
|
|
$ |
|
|
|
Balance at December 31, 2019 |
|
$ |
|
|
|
$ |
|
|
|
$ |
|
|
|
(1) |
Represents the amount of gains included in loan origination fees and gain on sale of loans, net due to changes in fair value of items accounted for using the fair value option. |
NOTE 3 - ACQUISITIONS
During 2019, the Company completed the acquisition of Vitek Real Estate Industries Group, Inc. (“Vitek”) through an Asset Purchase Agreement. On December 6, 2018, the Company announced a definitive agreement pursuant to which it would acquire certain assets of Vitek. Vitek was a mortgage loan originator with an experienced team of loan officers and an established presence in Northern California. This strategic acquisition expanded Guild’s presence in this region and added experienced loan officers to Guild’s sales force. The transaction closed on April 30, 2019.
The acquisition has been accounted for under the acquisition method of accounting pursuant to ASC 805, Business Combinations. Assets acquired and liabilities assumed are recorded at their fair value as of the date of acquisition based on management’s estimates using currently available information. The results of Vitek’s operations are included in Guild’s Consolidated Statements of Income from the date of acquisition. For U.S. income tax purposes the acquisition of Vitek is treated as an asset purchase.
Total cash consideration for the acquisition was approximately $ million. The purchase price allocation provided in the table below reflects the final determination of the fair value of assets acquired and liabilities assumed in the acquisition of Vitek, with the excess of total consideration over total identifiable net assets recorded as goodwill. Goodwill in the amount of $
|
|
|
Total |
|
|
|
Goodwill |
|
$ |
|
|
|
Mortgage servicing rights |
|
|
|
|
|
Fixed assets |
|
|
|
|
|
Other assets |
|
|
|
|
|
Accounts payable and accrued liabilities |
|
|
( |
) |
|
Net assets acquired |
|
$ |
|
|
|
|
|
|
|
|
|
|
|
Total |
|
|
|
Cash payments |
|
$ |
|
|
|
Contingent consideration |
|
|
|
|
|
Total purchase price |
|
$ |
|
|
The following table presents the results of operations of Vitek that are included in the Company’s Consolidated Statements of Income from the acquisition date of April 30, 2019 through December 31, 2019.
|
Revenues |
|
$ |
|
|
|
Expenses |
|
|
|
|
|
Net income |
|
$ |
|
|
There have been
58
NOTE 4 - ACCOUNTS AND INTEREST RECEIVABLE
Accounts and interest receivable consisted of the following at December 31, 2020 and 2019:
|
|
|
2020 |
|
|
2019 |
|
||
|
Trust advances |
|
$ |
|
|
|
$ |
|
|
|
Foreclosure advances, net |
|
|
|
|
|
|
|
|
|
Receivables related to loan sales |
|
|
|
|
|
|
|
|
|
Other |
|
|
|
|
|
|
|
|
|
Total accounts and interest receivable |
|
$ |
|
|
|
$ |
|
|
Management has established a foreclosure reserve for estimated uncollectable balances of the foreclosure and trust advances. Management believes that substantially all other accounts and interest receivable amounts are collectible and, accordingly, no allowance for doubtful accounts is necessary.
The activity of the foreclosure loss reserve was as follows for the years ended December 31, 2020 and 2019:
|
|
|
2020 |
|
|
2019 |
|
||
|
Balance — beginning of year |
|
$ |
|
|
|
$ |
|
|
|
Utilization of foreclosure reserve |
|
|
( |
) |
|
|
( |
) |
|
Provision charged to operations |
|
|
|
|
|
|
|
|
|
Balance — end of year |
|
$ |
|
|
|
$ |
|
|
NOTE 5 - OTHER ASSETS
Other assets consisted of the following at December 31, 2020 and 2019:
|
|
|
2020 |
|
|
2019 |
|
||
|
Prepaid expenses |
|
$ |
|
|
|
$ |
|
|
|
Company owned life insurance |
|
|
|
|
|
|
|
|
|
Property and equipment, net |
|
|
|
|
|
|
|
|
|
Right-of-use assets |
|
|
|
|
|
|
— |
|
|
Income tax receivable |
|
|
— |
|
|
|
|
|
|
Due from affiliates |
|
|
— |
|
|
|
|
|
|
Real estate owned |
|
|
|
|
|
|
|
|
|
Trading securities |
|
|
|
|
|
|
|
|
|
Total other assets |
|
$ |
|
|
|
$ |
|
|
Property and equipment consisted of the following at December 31, 2020 and 2019:
|
|
|
2020 |
|
|
2019 |
|
||
|
Computer equipment |
|
$ |
|
|
|
$ |
|
|
|
Furniture and equipment |
|
|
|
|
|
|
|
|
|
Leasehold improvements |
|
|
|
|
|
|
|
|
|
Internal-use software in production |
|
|
|
|
|
|
|
|
|
Internal-use software |
|
|
|
|
|
|
|
|
|
Property and equipment, gross |
|
|
|
|
|
|
|
|
|
Accumulated depreciation |
|
|
( |
) |
|
|
( |
) |
|
Property and equipment, net |
|
$ |
|
|
|
$ |
|
|
Depreciation and amortization expense for fixed assets was $
NOTE 6 - DERIVATIVE FINANCIAL INSTRUMENTS
The Company uses forward commitments in hedging the interest rate risk exposure on its fixed and adjustable rate commitments. The Company’s derivative instruments are not designated as hedging instruments; therefore, changes in fair value are recorded in current period earnings. Hedging gains and losses are included in loan origination fees and gain on sale of loans, net in the Consolidated Statements of Income.
Net unrealized hedging gains were as follows December 31, 2020 and 2019:
|
|
|
2020 |
|
|
2019 |
|
||
|
Unrealized hedging gains |
|
$ |
|
|
|
$ |
|
|
59
Notional and Fair Value
The notional and fair value of derivative financial instruments not designated as hedging instruments were as follows at December 31, 2020 and 2019:
|
|
|
|
|
|
|
Fair Value |
|
|||||
|
|
|
Notional Value |
|
|
Derivative Asset |
|
|
Derivative Liability |
|
|||
|
Balance at December 31, 2020 |
|
|
|
|
|
|
|
|
|
|
|
|
|
IRLCs |
|
$ |
|
|
|
$ |
|
|
|
$ |
— |
|
|
Forward commitments |
|
$ |
|
|
|
$ |
— |
|
|
$ |
|
|
|
Balance at December 31, 2019 |
|
|
|
|
|
|
|
|
|
|
|
|
|
IRLCs |
|
$ |
|
|
|
$ |
|
|
|
$ |
— |
|
|
Forward commitments |
|
$ |
|
|
|
$ |
— |
|
|
$ |
|
|
The Company had an additional $
The following table presents the quantitative information about IRLCs and the fair value measurements as of December 31, 2020 and 2019:
|
|
|
2020 |
|
2019 |
|
Unobservable Input |
|
Range (Weighted Average) |
||
|
Loan funding probability (“pull-through”) |
|
|
|
|
Counterparty agreements for forward commitments contain master netting agreements. The master netting agreements contain a legal right to offset amounts due to and from the same counterparty. The Company incurred
The table below represents financial liabilities that are subject to master netting arrangements or similar agreements categorized by financial instrument, together with corresponding financial instruments and corresponding collateral received or pledged.
|
|
|
Gross Amounts of Recognized Liabilities |
|
|
Gross Amounts Offset in the Balance Sheet |
|
Net Amounts of Recognized Liabilities in the Balance Sheet |
|
|||
|
December 31, 2020 |
|
|
|
|
|
|
|
|
|
|
|
|
Forward delivery commitments |
|
$ |
( |
) |
|
$ |
|
|
$ |
( |
) |
|
Best efforts sales commitments |
|
|
( |
) |
|
|
— |
|
|
( |
) |
|
Margin calls |
|
|
|
|
|
|
— |
|
|
|
|
|
Total liabilities |
|
$ |
( |
) |
|
$ |
|
|
$ |
( |
) |
|
December 31, 2019 |
|
|
|
|
|
|
|
|
|
|
|
|
Forward delivery commitments |
|
$ |
( |
) |
|
$ |
|
|
$ |
( |
) |
|
Best efforts sales commitments |
|
|
( |
) |
|
|
— |
|
|
( |
) |
|
Total liabilities |
|
$ |
( |
) |
|
$ |
|
|
$ |
( |
) |
NOTE 7 - MORTGAGE SERVICING RIGHTS
The activity of mortgage servicing rights was as follows for the years ended December 31, 2020 and 2019:
|
|
|
2020 |
|
|
2019 |
|
||
|
Balance — beginning of year |
|
$ |
|
|
|
$ |
|
|
|
MSRs originated and acquired through acquisitions |
|
|
|
|
|
|
|
|
|
Changes in fair value: |
|
|
|
|
|
|
|
|
|
Due to collection/realization of cash flows |
|
|
( |
) |
|
|
( |
) |
|
Due to changes in valuation model inputs or assumptions |
|
|
( |
) |
|
|
( |
) |
|
Balance — end of year |
|
$ |
|
|
|
$ |
|
|
The following table presents the weighted average discount rate, prepayment speed and cost to service assumptions used to determine the fair value of MSRs as of December 31, 2020 and 2019:
|
|
|
2020 |
|
2019 |
|
Unobservable Input |
|
Range (Weighted Average) |
||
|
Discount rate |
|
|
|
|
|
Prepayment rate |
|
|
|
|
|
Cost to service (per loan) |
|
|
|
|
60
At December 31, 2020 and 2019, the MSRs had a weighted average life of approximately
Actual revenue generated from servicing activities included contractually specified servicing fees, as well as late fees and other ancillary servicing revenue, which were recorded within loan servicing and other fees as follows for the years ended December 31, 2020 and 2019:
|
|
|
2020 |
|
|
2019 |
|
||
|
Servicing fees from servicing portfolio |
|
$ |
|
|
|
$ |
|
|
|
Late fees |
|
|
|
|
|
|
|
|
|
Other ancillary servicing revenue |
|
|
( |
) |
|
|
( |
) |
|
Total loan servicing and other fees |
|
$ |
|
|
|
$ |
|
|
At December 31, 2020 and 2019, the unpaid principal balance of mortgage loans serviced totaled $
The key assumptions used to estimate the fair value of MSRs are prepayment speeds, the discount rate and costs to service. Increases in prepayment speeds generally have an adverse effect on the value of MSRs as the underlying loans prepay faster. In a declining interest rate environment, the fair value of MSRs generally decreases as prepayments increase and therefore, the estimated life of the MSRs and related cash flows decrease. Decreases in prepayment speeds generally have a positive effect on the value of MSRs as the underlying loans prepay less frequently. In a rising interest rate environment, the fair value of MSRs generally increases as prepayments decrease and therefore, the estimated life of the MSRs and related cash flows increase. Increases in the discount rate generally have an adverse effect on the value of the MSRs. The discount rate is risk adjusted for key factors such as uncertainty in the mortgage banking industry due to its reliance on external influences (interest rates, regulatory changes, etc.), premium for market liquidity, and credit risk. A higher discount rate would indicate higher uncertainty of the future cash flows. Conversely decreases in the discount rate generally have a positive effect on the value of the MSRs. Increases in the costs to service generally have an adverse effect on the value of the MSRs as an increase in costs to service would reduce the Company’s future net cash inflows from servicing a loan. Conversely deceases in the costs to service generally have a positive effect on the value of the MSRs. MSR uncertainties are hypothetical and do not always have a direct correlation with each assumption. Changes in one assumption may result in changes to another assumption, which might magnify or counteract the uncertainties.
The following table illustrates the impact of adverse changes on the prepayment speeds, discount rate and cost to service at two different data points at December 31, 2020 and 2019, respectively:
|
|
|
Prepayment Speeds |
|
Discount Rate |
|
|
Cost to Service (per loan) |
|
|||||||||||||||
|
|
|
10% Adverse Change |
|
|
20% Adverse Change |
|
10% Adverse Change |
|
|
20% Adverse Change |
|
|
10% Adverse Change |
|
|
20% Adverse Change |
|
||||||
|
December 31, 2020 |
|
|
|
|
|
|
|
|
|
|
|
|
|
|
|
|
|
|
|
|
|
|
|
|
Mortgage servicing rights |
|
$ |
( |
) |
|
$ |
( |
) |
$ |
( |
) |
|
$ |
( |
) |
|
$ |
( |
) |
|
$ |
( |
) |
|
December 31, 2019 |
|
|
|
|
|
|
|
|
|
|
|
|
|
|
|
|
|
|
|
|
|
|
|
|
Mortgage servicing rights |
|
$ |
( |
) |
|
$ |
( |
) |
$ |
( |
) |
|
$ |
( |
) |
|
$ |
( |
) |
|
$ |
( |
) |
61
NOTE 8 - MORTGAGE LOANS HELD FOR SALE
The Company sells substantially all of its originated mortgage loans into the secondary market. The Company may retain the right to service some of these loans upon sale through ownership of servicing rights.
|
|
|
2020 |
|
|
2019 |
|
||
|
Balance at the beginning of period |
|
$ |
|
|
|
$ |
|
|
|
Origination of mortgage loans held for sale |
|
|
|
|
|
|
|
|
|
Proceeds on sale of payments from mortgage loans held for sale |
|
|
( |
) |
|
|
( |
) |
|
Gain on sale of mortgage loans excluding fair value of other financial instruments, net |
|
|
|
|
|
|
|
|
|
Valuation adjustment of mortgage loans held for sale |
|
|
|
|
|
|
|
|
|
Balance at the end of period |
|
$ |
|
|
|
$ |
|
|
At December 31, 2020, mortgage loans held for sale included unpaid principal balances of the underlying loans of $
NOTE 9 - LEASES
On January 1, 2020, we adopted Topic 842. Results for reporting periods beginning January 1, 2020 are presented in accordance with Topic 842, while prior period amounts are reported in accordance with Topic 840 – Leases. The Company used the optional transition method to the modified retrospective approach, which eliminates the requirement to restate the prior period financial statements. On January 1, 2020, we recognized approximately $
The Company determines if an arrangement is or contains a lease at inception, which is the date on which the terms of the contract are agreed to and the agreement creates enforceable rights and obligations. The Company also considers whether its service arrangements include the right to control the use of an asset.
The Company leases office space under operating lease agreements that have initial terms ranging from
A number of practical expedients and policy elections are available under the new guidance to reduce the burden of adoption and ongoing compliance with Topic 842. The Company elected the “package of practical expedients”, which permitted the Company to retain lease classification and initial direct costs for any identified leases that exist prior to adoption of Topic 842. Under this transition guidance, the Company also has not reassessed whether any existing contracts at January 1, 2020 are or contain leases and has carried forward its initial determination under legacy lease guidance. The Company has not elected to adopt the “hindsight” practical expedient, and therefore will measure the ROU asset and lease liability using the remaining portion of the lease term at adoption on January 1, 2020.
The Company made an accounting policy election available under the new lease standard to not recognize lease assets and lease liabilities for leases with a term of 12 months or less. For all other leases, the initial measurement of the ROU asset and lease liability is based on the present value of future lease payments over the lease term at the commencement date of the lease (or January 1, 2020 for existing leases upon the adoption of Topic 842). Lease payments may include fixed rent escalation clauses or payments that depend on an index or a rate (such as the consumer price index) measured using the index or applicable rate at lease commencement. Subsequent changes in the index or rate and any other variable payments, such as market-rate base rent adjustments, are recognized as variable lease expense in the period incurred. Payments for terminating a lease are included in lease payments only when it is probable they will be incurred. To determine the present value of lease payments, the Company uses its incremental borrowing rate, as the leases generally do not have a readily determinable implicit discount rate. The Company applies judgement in assessing factors such as Company-specific credit risk, lease term, nature and quality of the underlying collateral and the economic environment in determining the lease-specific incremental borrowing rate. The ROU assets also adjusted for any initial direct costs incurred and lease payments made at or before the commencement date and are reduced by lease incentives.
The Company’s leases generally include a non-lease component representing additional services transferred to the Company, such as common area maintenance for real estate. The Company has made an accounting policy election to account for lease and non-lease components in its contacts as a single lease component for all asset classes. The non-lease components are usually variable in nature and recorded in variable lease expense in the period incurred.
62
All leases recognized in our Consolidated Balance Sheet as of December 31, 2020 are classified as operating leases, which include leases related to the asset classes reflected in the table below. ROU assets are included in Other assets in our Consolidated Balance Sheet:
|
|
|
Right-of-Use Assets |
|
|
Lease Liability |
|
||
|
Office leases |
|
$ |
|
|
|
$ |
|
|
|
Equipment |
|
|
|
|
|
|
|
|
|
Total |
|
$ |
|
|
|
$ |
|
|
We recognize lease expense on a straight-line basis excluding short-term and variable lease payments which are recognized as incurred. Short-term lease cost represents payments for leases with a lease term of twelve months or less, excluding leases with a term of one month or less.
The following table summarizes the components of our gross operating lease costs incurred during the year ended December 31, 2020:
|
(in thousands) |
|
Amount |
|
|
|
Operating lease cost |
|
$ |
|
|
|
Short-term lease cost |
|
|
|
|
|
Variable lease cost |
|
|
|
|
|
Total lease cost |
|
$ |
|
|
Rent expense amounted to $
Our weighted-average lease term and discount rate used are as follows:
|
|
|
December 31, 2020 |
|
|
|
Weighted-average lease term (years) |
|
|
|
|
|
Weighted-average discount rate |
|
|
|
% |
The following table summarizes supplemental cash flow information related to operating leases:
|
|
|
2020 |
|
|
|
Cash paid for operating leases |
|
$ |
|
|
|
Right-of-use assets obtained in exchange for new operating lease obligations |
|
$ |
|
|
Minimum future commitments by year for our long-term operating leases as of December 31, 2020 are presented in the table below. Such commitments are reflected at undiscounted values and are reconciled to the discounted present value recognized in the balance sheet as follows:
|
|
|
Amount |
|
|
|
2021 |
|
$ |
|
|
|
2022 |
|
|
|
|
|
2023 |
|
|
|
|
|
2024 |
|
|
|
|
|
2025 |
|
|
|
|
|
Thereafter |
|
|
|
|
|
Total future minimum lease payments |
|
$ |
|
|
|
Less: imputed interest |
|
|
( |
) |
|
Total lease liabilities |
|
$ |
|
|
Future minimum rental payments under the noncancelable operating leases are as follows at December 31, 2019:
|
2020 |
|
$ |
|
|
|
2021 |
|
|
|
|
|
2022 |
|
|
|
|
|
2023 |
|
|
|
|
|
2024 |
|
|
|
|
|
Thereafter |
|
|
|
|
|
|
|
$ |
|
|
63
NOTE 10 - GOODWILL
A summary of the activity in goodwill is presented below for the years ended December 31, 2020 and 2019:
|
Balance at December 31, 2018 |
|
$ |
|
|
|
2019 Acquisitions (Note 3) |
|
|
|
|
|
Balance at December 31, 2019 |
|
$ |
|
|
|
Balance at December 31, 2020 |
|
$ |
|
|
The Company conducted its annual goodwill impairment test during the fourth quarter of 2020 and determined that goodwill was
NOTE 11 - INVESTOR RESERVES
The Company’s estimate of the investor reserves consider the current macro-economic environment and recent repurchase trends; however, if the Company experiences a prolonged period of higher repurchase and indemnification activity, then the realized losses from loan repurchases and indemnifications may ultimately be in excess of the liability. The maximum exposure under the Company’s representations and warranties would be the outstanding principal balance and any premium received on all loans ever sold by the Company, less any loans that have already been paid in full by the mortgagee, that have defaulted without a breach of representations and warranties, that have been indemnified via settlement or make-whole, or that have been repurchased. Additionally, the Company may receive relief of certain representations and warranty obligations on loans sold to FNMA or FHLMC on or after January 1, 2013 if FNMA or FHLMC satisfactorily concludes a quality control loan file review or if the borrower meets certain acceptable payment history requirements within 12 or 36 months after the loan is sold to FNMA or FHLMC.
The activity of the investor reserves was as follows for the years ended December 31, 2020 and 2019:
|
|
|
2020 |
|
|
2019 |
|
||
|
Balance — beginning of year |
|
$ |
|
|
|
$ |
|
|
|
Benefit from investor reserves |
|
|
( |
) |
|
|
( |
) |
|
Provision for investor reserves charged to operations |
|
|
|
|
|
|
|
|
|
Balance — end of year |
|
$ |
|
|
|
$ |
|
|
NOTE 12 - WAREHOUSE LINES OF CREDIT
Warehouse lines of credit consisted of the following at December 31, 2020 and 2019. Changes subsequent to December 31, 2020 have been described in the notes referenced with the below table.
|
|
|
Maturity as of December 31, 2020 |
|
2020 |
|
|
2019 |
|
||
|
$800 million master repurchase facility agreement(1) |
|
January 2021 |
|
$ |
|
|
|
$ |
|
|
|
$250 million master repurchase facility agreement(2) |
|
September 2021 |
|
|
|
|
|
|
|
|
|
$700 million master repurchase facility agreement(3) |
|
February 2021 |
|
|
|
|
|
|
|
|
|
$200 million master repurchase facility agreement(4) |
|
May 2021 |
|
|
|
|
|
|
|
|
|
$300 million master repurchase facility agreement(5) |
|
September 2021 |
|
|
|
|
|
|
|
|
|
$500 million master repurchase facility agreement(6) |
|
July 2021 |
|
|
|
|
|
|
|
|
|
$200 million master repurchase facility agreement (7) |
|
April 2021 |
|
|
|
|
|
|
— |
|
|
$75 million master repurchase facility agreement(8) |
|
March 2024 |
|
|
|
|
|
|
|
|
|
|
|
|
|
|
|
|
|
|
|
|
|
Prepaid commitment fees |
|
|
|
|
( |
) |
|
|
( |
) |
|
Net warehouse lines of credit |
|
|
|
$ |
|
|
|
$ |
|
|
|
(1) |
The variable interest rate is calculated using a base rate tied to LIBOR, the Eurodollar, or an alternative base rate with a floor of |
|
(2) |
The variable interest rate is calculated using a base rate tied to LIBOR, plus the applicable interest rate margin. This line of credit requires a minimum deposit of $ |
|
(3) |
The variable interest rate is calculated using a base rate tied to LIBOR, plus the applicable interest rate margin. This line of credit was amended subsequent to December 31, 2020 with a maturity date of February 2022 and was reduced to $ |
|
(4) |
The variable interest rate is calculated using a base rate plus LIBOR, with a floor of |
|
(5) |
The variable interest rate is calculated using a base rate tied to LIBOR with a floor of |
|
(6) |
The variable interest rate is calculated using a base rate tied to LIBOR with a floor of |
64
|
(7) |
The variable interest rate is calculated using a base rate tied to LIBOR with a floor of |
|
(8) |
The interest rate on this facility is 3.375%. This facility was opened in 2019 and is used for GNMA delinquent buyouts. Each buyout represents a separate transaction that can remain on the facility for up to |
Subsequent to December 31, 2020, the Company entered into a master purchase agreement with a new lender. The facility size is $
The weighted average interest rate for warehouse lines of credit was
The agreements governing the Company’s warehouse lines of credit contain covenants that include certain financial requirements, including maintenance of maximum adjusted leverage ratio, minimum net worth, minimum tangible net worth, minimum current ratio, minimum liquidity, positive quarterly income and limitations on additional indebtedness, dividends, sale of assets, and decline in the mortgage loan servicing portfolio’s fair value. At December 31, 2020 and 2019, management believes the Company was in compliance with all debt covenants.
The Company has an optional short-term financing agreement between FNMA and the lender described as “As Soon As Pooled” (ASAP). The Company can elect to assign FNMA MBS trades to FNMA in advance of settlement and enter into a financing transaction and revenue related to the assignment is deferred until the final pool settlement date. The Company determines utilization based on warehouse availability and cash needs. There was no outstanding balance as of December 31, 2020 and 2019.
NOTE 13 - NOTES PAYABLE
Revolving Notes:
In January 2014, the Company entered into an agreement for a revolving note from one of its warehouse banks, which it can draw upon as needed and has renewed on an annual basis. Borrowings on the revolving note are collateralized by the Company’s GNMA MSRs. Monthly interest on the outstanding balance is calculated using a base rate tied to the LIBOR rate plus the applicable margin, with a floor of
In July 2017, the Company entered into an agreement for a revolving note of up to $
Term Note:
In January 2014, the Company entered into a term note agreement with one of its warehouse banks collateralized by the Company’s FNMA MSRs. In September 2019, the term note was amended and restated, at which time there was an outstanding amount of $
The minimum calendar year payments of the Company’s term note as of December 31, 2020 are as follows:
|
2021 |
|
$ |
|
|
|
2022 |
|
|
|
|
|
Total |
|
$ |
|
|
65
NOTE 14 - INCOME TAXES
On March 27, 2020, the Coronavirus Aid, Relief, and Economic Security Act ("CARES Act") was enacted and signed into law, and GAAP requires recognition of the tax effects of new legislation during the reporting period that includes the enactment date. The CARES Act introduced a number of tax law changes which are generally taxpayer favorable. In December 2020 the Taxpayer Certainty and Disaster Tax Relief Act was signed into law. No material changes in our effective income tax rates resulted from the either Act. The Company continues to examine additional impacts that the CARES Act may have on the business, and other operations impacted by COVID-19. The effects and ultimate results of our evaluation, if any, could result in temporary book-to-tax timing differences (i.e., no effective tax rate impact) for income tax purposes.
The components of income tax expense were as follows for the years ended December 31, 2020 and 2019:
|
|
|
2020 |
|
|
2019 |
|
||
|
Current tax expense: |
|
|
|
|
|
|
|
|
|
Federal |
|
$ |
|
|
|
$ |
|
|
|
State |
|
|
|
|
|
|
|
|
|
|
|
$ |
|
|
|
$ |
|
|
|
Deferred tax expense (benefit): |
|
|
|
|
|
|
|
|
|
Federal |
|
$ |
|
|
|
$ |
( |
) |
|
State |
|
|
|
|
|
|
( |
) |
|
|
|
|
|
|
|
|
( |
) |
|
Income tax expense |
|
$ |
|
|
|
$ |
|
|
The following table presents a reconciliation of the recorded income tax expense of continuing operations to the amount of taxes computed by applying the applicable statutory federal income tax rate of
|
|
|
2020 |
|
|
2019 |
|
||||||||||
|
|
|
Amount |
|
|
Percent |
|
|
Amount |
|
|
Percent |
|
||||
|
Income tax expense at federal statutory rate |
|
$ |
|
|
|
|
|
% |
|
$ |
|
|
|
|
|
% |
|
State income taxes, net of federal tax benefit |
|
|
|
|
|
|
|
% |
|
|
|
|
|
|
|
% |
|
Nondeductible deferred compensation |
|
|
|
|
|
|
|
% |
|
|
— |
|
|
|
— |
% |
|
Permanent items |
|
|
|
|
|
|
|
% |
|
|
( |
) |
|
|
( |
)% |
|
Federal and state tax credits, net of federal tax benefit |
|
|
( |
) |
|
|
( |
)% |
|
|
( |
) |
|
|
( |
)% |
|
Deferred compensation adjustment |
|
|
( |
) |
|
|
( |
)% |
|
|
— |
|
|
|
— |
% |
|
Other, net |
|
|
|
|
|
|
|
% |
|
|
|
|
|
|
|
% |
|
|
|
$ |
|
|
|
|
|
% |
|
$ |
|
|
|
|
|
% |
The tax effects of significant temporary differences which gave rise to the Company’s deferred tax assets and liabilities are as follows at December 31, 2020 and 2019:
|
|
|
2020 |
|
|
2019 |
|
||
|
Deferred tax assets: |
|
|
|
|
|
|
|
|
|
Mortgage loans held for sale |
|
$ |
|
|
|
$ |
|
|
|
Intangible assets |
|
|
|
|
|
|
|
|
|
Accrued compensation and benefits |
|
|
|
|
|
|
|
|
|
Deferred compensation |
|
|
|
|
|
|
|
|
|
Lease liability |
|
|
|
|
|
|
— |
|
|
Other accrued liabilities |
|
|
|
|
|
|
|
|
|
Total deferred tax assets |
|
$ |
|
|
|
$ |
|
|
|
Deferred tax liabilities: |
|
|
|
|
|
|
|
|
|
Mortgage servicing rights |
|
$ |
( |
) |
|
$ |
( |
) |
|
Trading securities |
|
|
( |
) |
|
|
( |
) |
|
Derivatives |
|
|
( |
) |
|
|
( |
) |
|
Right-of-use assets |
|
|
( |
) |
|
|
— |
|
|
Property and equipment |
|
|
( |
) |
|
|
( |
) |
|
Total deferred tax liabilities |
|
|
( |
) |
|
|
( |
) |
|
Net deferred tax liabilities |
|
$ |
( |
) |
|
$ |
( |
) |
In assessing the realizability of deferred tax assets, management considers whether it is more likely than not that some portion or all of the deferred tax assets will not be realized. The ultimate realization of deferred tax assets is dependent upon the generation of future taxable income during the periods in which those temporary differences become deductible. Management considers the scheduled reversal of deferred tax liabilities including the impact of available carryback and carryforward periods and projected future taxable income. Based upon the level of historical taxable income and projections for future taxable income over the periods in which the deferred tax assets are deductible, management believes it is more likely than not that the Company will realize the benefits of these deductible differences. There are
At December 31, 2020 the Company had
66
The Company records interest related to unrecognized tax benefits in interest expense and records penalties as a component of income taxes. There are
NOTE 15 - EARNINGS PER SHARE
Prior to the IPO, the Guild Mortgage Company LLC membership structure included several different types of LLC interests including ownership interests and profits interests. The Company analyzed the calculation of earnings per unit for periods prior to the IPO using the two-class method and determined that it resulted in values that would not be meaningful to the user of these consolidated financial statements. Therefore, earnings per share information has not been presented for periods prior to October 22, 2020. The basic and diluted earnings per share represent only the period from October 22, 2020 to December 31, 2020.
Basic earnings per share is computed based on the weighted average number of shares of Class A and Class B shares outstanding during the period using the two-class method. Diluted earnings per share is computed based on the weighted average number of shares plus the effect of dilutive potential common shares outstanding during the period using the treasury stock method. Dilutive potential common shares include restricted stock units for Class A common stock.
The following table sets forth the components of basic and diluted earnings per share for the year ended December 31, 2020:
|
|
|
2020 |
|
|
|
Net income available for Class A and Class B Common Stock |
|
$ |
|
|
|
|
|
|
|
|
|
Weighted-average shares outstanding, Class A Common Stock |
|
|
|
|
|
Weighted-average shares outstanding, Class B Common Stock |
|
|
|
|
|
Weighted-average shares outstanding - basic |
|
|
|
|
|
|
|
|
|
|
|
Add dilutive effects of non-vested shares of restricted stock - Class A |
|
|
|
|
|
Weighted-average shares outstanding - diluted |
|
|
|
|
|
|
|
|
|
|
|
Basic earnings per share: |
|
|
|
|
|
Class A and Class B Common Stock |
|
$ |
|
|
|
Diluted earnings per share: |
|
|
|
|
|
Class A and Class B Common Stock |
|
$ |
|
|
Capital Stock
The Company has two classes of common stock: Class A and Class B. Class A common stock is traded on the New York Stock Exchange under the symbol “GHLD.” There is no public market for the Company’s Class B common stock. However, under the terms of the Company’s Articles of Incorporation, the holder of Class B common stock may convert any portion or all of the holder’s shares of Class B common stock into an equal number of shares of Class A common stock at any time.
The holders of the Class A common stock and Class B common stock are entitled to dividends when and if declared by the Company’s Board of Directors out of legally available funds. Any stock dividend must be paid in shares of Class A common stock with respect to Class A common stock and in shares of Class B common stock with respect to Class B common stock.
The voting powers, preferences and relative rights of Class A common stock and Class B common stock are identical in all respects, except that the holders of Class A common stock have
Restricted Stock Units
The Company issues RSUs, which represent the right to receive, upon vesting,
67
NOTE 16 - STOCK-BASED COMPENSATION AND EMPLOYEE BENEFIT PLANS
Incentive Plan
In October 2020, the Company’s stockholders approved the 2020 Omnibus Incentive Plan (the “2020 Plan”), which is administered by the Compensation Committee of the Board of Directors. The 2020 Plan reserves for issuance a total of
The 2020 Plan provides for the granting of incentive stock options, nonstatutory stock options, stock appreciation rights, restricted stock awards, restricted stock unit awards or a combination of the foregoing, to employees, directors or consultants, provided that only employees may be granted incentive stock options.
As of December 31, 2020, there were approximately
Restricted Stock Units
RSUs were granted to employees and directors in connection with the IPO in October 2020. The RSUs granted to employees vest ratably over
The following table shows a summary of the unvested restricted stock under the 2020 Plan as of December 31, 2020 as well as activity during the year:
|
|
|
Weighted Average |
|
|||||
|
|
|
Number of Shares |
|
|
Grant Date Fair Value |
|
||
|
Restricted stock awards, unvested, January 1, 2020 |
|
|
— |
|
|
$ |
— |
|
|
Granted |
|
|
|
|
|
|
|
|
|
Vested |
|
|
— |
|
|
|
— |
|
|
Forfeited |
|
|
— |
|
|
|
— |
|
|
Restricted stock awards, unvested, December 31, 2020 |
|
|
|
|
|
$ |
|
|
Compensation costs recognized for these restricted stock grants were approximately $
Defined Contribution Plan
The Company has a 401(k) profit sharing plan covering substantially all employees. Employees may contribute amounts subject to certain Internal Revenue Service and plan limitations. The Company may make discretionary matching and nonelective contributions. For the years ended December 31, 2020 and 2019, the Company contributed $
Deferred Compensation Plan
In 2017, the Company commenced a Non-Qualified Deferred Compensation Plan for certain highly compensated executives and employees that allows the participants to defer a portion of their earnings. Distribution of a participant’s vested balance is payable in a single lump sum upon death or disability; termination of employment; retirement; or upon termination of the plan.
Guild Equity Appreciation Rights Plan
In 2013, the Company established the Guild Equity Appreciation Rights (“GEARs”) Plan for certain executives that compensates participants with GEARs that, if vested, will ultimately be settled in cash on the final vesting date. The awards have a vesting period in addition to annual performance vesting conditions. Compensation expense related to the GEARs awards is recognized over the vesting period based on the change in the fair value of the award and the likelihood of achieving the performance vesting criteria.
In 2017, the Company established a new GEARs Plan for certain executives compensated with GEARs that will ultimately be settled in cash at maturity. Maturity is the earlier of (i) a change of control; (ii) the participant’s retirement; (iii) the participant’s death; (iv) the determination that the participant has suffered a disability; or (v) the involuntary termination of the participant’s employment with the Company and its subsidiaries without cause. The awards vest immediately, and compensation related to these GEARs awards is recognized over the participant’s service period based on the change in the fair value of the award.
For the year ended December 31, 2020, the Company recognized $
68
NOTE 17 - COMMITMENTS AND CONTINGENCIES
Commitments to Extend Credit
The Company enters into interest rate lock commitments with customers who have applied for residential mortgage loans and meet certain credit and underwriting criteria. These commitments expose the Company to market risk if interest rates change and the loan is not economically hedged or committed to an investor. The Company is also exposed to credit loss if the loan is originated and not sold to an investor and the customer does not perform. The collateral upon extension of credit typically consists of a first deed of trust in the mortgagor’s residential property. Commitments to originate loans do not necessarily reflect future cash requirements as some commitments are expected to expire without being drawn upon. Total commitments to originate loans at December 31, 2020 and 2019 were approximately $
The Company manages the interest rate price risk associated with its outstanding interest rate lock commitments and loans held for sale by entering into derivative loan instruments such as forward loan sales commitments, mandatory delivery commitments, options and futures contracts. Total commitments related to these derivatives at December 31, 2020 and 2019 were approximately $
Legal
The Company is involved in various lawsuits arising in the ordinary course of business. While the ultimate results of these lawsuits cannot be predicted with certainty, management does not expect that these matters will have a material adverse effect on the consolidated financial position or results of operations of the Company.
U.S. ex rel. Dougherty v. Guild Mortgage Company, No. 16-cv-02909 (S.D. Cal.)
On
On August 10, 2016, the Company filed motions to dismiss the government’s Intervention Complaint and the Relator’s Third Amended Complaint. In March 2018, the Court stayed the case pending the Ninth Circuit’s determination of the appeal in Rose v Stephens Institute (No. 17-15111). On August 24, 2018, the ruling in the Rose case was issued and the Court lifted its self-imposed stay. On March 4, 2019, the government filed an amended complaint which Guild responded to on March 22, 2019 reasserting that the claims were without merit. Guild’s motion to dismiss was denied by the court in September 2019. Discovery began in December 2019.
On
NOTE 18 - RELATED PARTY TRANSACTIONS
In November 2014, one of GMC’s executives retired. Other executives of GMC had the option and executed their right to purchase the retiring executive’s units in Guild Management, LLC, an indirect parent company of GMC prior to the IPO. The purchase was funded by GMC and, in return, GMC received a note receivable from Guild Management, LLC for approximately $
In April 2017, Guild Investors, LLC, GMC’s former parent prior to the IPO, sold units to Guild Management III, LLC for $
On January 1, 2019, one of GMC’s executives retired, which triggered a repurchase of the executive’s membership interest in Guild Management, LLC, and a one-time payout of $
NOTE 19 - MINIMUM NET WORTH REQUIREMENTS
Certain secondary market investors and state regulators require the Company to maintain minimum net worth and capital requirements. To the extent that these requirements are not met, secondary market investors and/or the state regulators may utilize a range of remedies including sanctions, and/or suspension or termination of selling and servicing agreements, which may prohibit the Company from originating, securitizing or servicing these specific types of mortgage loans.
The Company is subject to the following minimum net worth, minimum capital ratio and minimum liquidity requirements established by the Federal Housing Finance Agency for Fannie Mae and Freddie Mac Seller/Servicers, and Ginnie Mae for single family issuers.
69
Minimum Net Worth
The minimum net worth requirement for Fannie Mae and Freddie Mac is defined as follows:
|
|
• |
Base of $ |
|
|
• |
Adjusted/Tangible Net Worth comprises of total equity less goodwill, intangible assets, affiliate receivables and certain pledged assets. |
The minimum net worth requirement for Ginnie Mae is defined as follows:
|
|
• |
Base of $ |
|
|
• |
Adjusted/Tangible Net Worth comprises of total equity less goodwill, intangible assets, affiliate receivables and certain pledged assets. |
Minimum Capital Ratio
|
|
• |
For Fannie Mae, Freddie Mac and Ginnie Mae the Company is also required to hold a ratio of Adjusted/Tangible Net Worth to Total Assets greater than |
Minimum Liquidity
The minimum liquidity requirement for Fannie Mae and Freddie Mac is defined as follows:
|
|
• |
|
|
|
• |
Incremental |
|
|
• |
Allowable assets for liquidity may include: cash and cash equivalents (unrestricted); available for sale or held for trading investment grade securities (e.g., Agency MBS, Obligations of GSEs, US Treasury Obligations); and unused/available portion of committed servicing advance lines. |
The minimum liquidity requirement for Ginnie Mae is defined as follows:
|
|
• |
Maintain liquid assets equal to the greater of $ |
The most restrictive of the minimum net worth and capital requirements require the Company to maintain a minimum adjusted net worth balance of $
NOTE 20 - ADDITIONAL NON-CASH DISCLOSURES
For the years ended December 31, 2020 and 2019, the Company had the following non-cash transactions that are not included in the Consolidated Statements of Cash Flows.
|
|
|
2020 |
|
|
2019 |
|
||
|
GNMA inventory obtained due to delinquent status of GNMA serviced loans |
|
$ |
|
|
|
$ |
|
|
|
GNMA inventory removed from delinquent status |
|
|
( |
) |
|
|
( |
) |
|
GNMA real estate owned resolved through finalized foreclosure sale (conveyed to HUD) |
|
|
( |
) |
|
|
( |
) |
|
Reduction in GNMA inventory due to loan removal from pool |
|
|
( |
) |
|
|
( |
) |
|
Net increase of GNMA payable due to receipt or resolution of GNMA inventory and GNMA real estate owned |
|
$ |
|
|
|
$ |
|
|
|
GNMA real estate owned obtained through foreclosure sale of GNMA serviced loans |
|
$ |
|
|
|
$ |
|
|
NOTE 21 - SEGMENTS
ASC 280, Segment Reporting, establishes the standards for reporting information about segments in financial statements. In applying the criteria set forth in that guidance, the Company has determined that it has
Origination — The Company operates its loan origination business in approximately
Servicing — The Company services loans out of its corporate office in San Diego, California. Properties of the loans serviced by the Company are disbursed throughout the United States and as of December 31, 2020 the Company serviced at least
The Company does not allocate assets to its reportable segments as they are not included in the review performed by the Chief Operating Decision Maker for purposes of assessing segment performance and allocating resources. The balance sheet is managed on a consolidated basis and is not used in the context of segment reporting.
70
The Company also does not allocate certain corporate expenses, which are represented by All Other in the tables below.
The following table presents the financial performance and results by segment for the year ended December 31, 2020:
|
|
|
Origination |
|
|
Servicing |
|
|
Total Segments |
|
|
All Other |
|
|
Total |
|
|||||
|
Revenue |
|
|
|
|
|
|
|
|
|
|
|
|
|
|
|
|
|
|
|
|
|
Loan origination fees and gain on sale of loans, net |
|
$ |
|
|
|
$ |
|
|
|
$ |
|
|
|
$ |
— |
|
|
$ |
|
|
|
Loan servicing and other fees |
|
|
— |
|
|
|
|
|
|
|
|
|
|
|
— |
|
|
|
|
|
|
Valuation adjustment of mortgage servicing rights |
|
|
— |
|
|
|
( |
) |
|
|
( |
) |
|
|
— |
|
|
|
( |
) |
|
Interest income (expense) |
|
|
|
|
|
|
( |
) |
|
|
|
|
|
|
( |
) |
|
|
( |
) |
|
Other income, net |
|
|
|
|
|
|
|
|
|
|
|
|
|
|
|
|
|
|
|
|
|
Net revenue |
|
|
|
|
|
|
( |
) |
|
|
|
|
|
|
( |
) |
|
|
|
|
|
Expenses |
|
|
|
|
|
|
|
|
|
|
|
|
|
|
|
|
|
|
|
|
|
Salaries, incentive compensation and benefits |
|
|
|
|
|
|
|
|
|
|
|
|
|
|
|
|
|
|
|
|
|
General and administrative |
|
|
|
|
|
|
|
|
|
|
|
|
|
|
|
|
|
|
|
|
|
Occupancy, equipment and communication |
|
|
|
|
|
|
|
|
|
|
|
|
|
|
|
|
|
|
|
|
|
Depreciation and amortization |
|
|
|
|
|
|
|
|
|
|
|
|
|
|
|
|
|
|
|
|
|
Provision for foreclosure losses |
|
|
— |
|
|
|
|
|
|
|
|
|
|
|
— |
|
|
|
|
|
|
Income tax expense |
|
|
— |
|
|
|
— |
|
|
|
— |
|
|
|
|
|
|
|
|
|
|
Net income (loss) |
|
$ |
|
|
|
$ |
( |
) |
|
$ |
|
|
|
$ |
( |
) |
|
$ |
|
|
The following table presents the financial performance and results by segment for the year ended December 31, 2019:
|
|
|
Origination |
|
|
Servicing |
|
|
Total Segments |
|
|
All Other |
|
|
Total |
|
|||||
|
Revenue |
|
|
|
|
|
|
|
|
|
|
|
|
|
|
|
|
|
|
|
|
|
Loan origination fees and gain on sale of loans, net |
|
$ |
|
|
|
$ |
|
|
|
$ |
|
|
|
$ |
— |
|
|
$ |
|
|
|
Loan servicing and other fees |
|
|
— |
|
|
|
|
|
|
|
|
|
|
|
— |
|
|
|
|
|
|
Valuation adjustment of mortgage servicing rights |
|
|
— |
|
|
|
( |
) |
|
|
( |
) |
|
|
— |
|
|
|
( |
) |
|
Interest income (expense) |
|
|
|
|
|
|
|
|
|
|
|
|
|
|
( |
) |
|
|
|
|
|
Other income, net |
|
|
|
|
|
|
— |
|
|
|
|
|
|
|
|
|
|
|
|
|
|
Net revenue |
|
|
|
|
|
|
( |
) |
|
|
|
|
|
|
( |
) |
|
|
|
|
|
Expenses |
|
|
|
|
|
|
|
|
|
|
|
|
|
|
|
|
|
|
|
|
|
Salaries, incentive compensation and benefits |
|
|
|
|
|
|
|
|
|
|
|
|
|
|
|
|
|
|
|
|
|
General and administrative |
|
|
|
|
|
|
|
|
|
|
|
|
|
|
|
|
|
|
|
|
|
Occupancy, equipment and communication |
|
|
|
|
|
|
|
|
|
|
|
|
|
|
|
|
|
|
|
|
|
Depreciation and amortization |
|
|
|
|
|
|
|
|
|
|
|
|
|
|
|
|
|
|
|
|
|
Provision for foreclosure losses |
|
|
— |
|
|
|
|
|
|
|
|
|
|
|
— |
|
|
|
|
|
|
Income tax expense |
|
|
— |
|
|
|
— |
|
|
|
— |
|
|
|
|
|
|
|
|
|
|
Net income (loss) |
|
$ |
|
|
|
$ |
( |
) |
|
|
|
|
|
$ |
( |
) |
|
$ |
|
|
71
ITEM 9. CHANGES IN AND DISAGREEMENTS WITH ACCOUNTANTS ON ACCOUNTING AND FINANCIAL DISCLOSURE
None.
ITEM 9A. CONTROLS AND PROCEDURES
Evaluation of Disclosure Controls and Procedures
Under the supervision and with the participation of our management, including our principal executive officer and principal financial and accounting officer, we conducted an evaluation of the effectiveness of our disclosure controls and procedures as of December 31, 2020, as such term is defined in Rules 13a-15(e) and 15d-15(e) under the Exchange Act. Based on this evaluation, our principal executive officer and principal financial and accounting officer have concluded that during the period covered by this Annual Report, our disclosure controls and procedures were effective.
Disclosure controls and procedures are designed to ensure that information required to be disclosed by us in our Exchange Act reports is recorded, processed, summarized, and reported within the time periods specified in the SEC’s rules and forms, and that such information is accumulated and communicated to our management, including our principal executive officer and principal financial officer or persons performing similar functions, as appropriate to allow timely decisions regarding required disclosure.
Internal Control over Financial Reporting
This Annual Report does not include a report of management’s assessment regarding internal control over financial reporting or an attestation report of the company’s registered public accounting firm due to a transition period established by rules of the Securities and Exchange Commission for newly public companies.
Changes in Internal Control over Financial Reporting
Our management is not required to evaluate the effectiveness of our internal control over financial reporting until after the filing of our Annual Report on Form 10-K for the year ended December 31, 2021. As a result, this Annual Report does not address whether there have been any changes in our internal control over financial reporting.
ITEM 9B. OTHER INFORMATION
None.
72
part III
ITEM 10. DIRECTORS, EXECUTIVE OFFICERS AND CORPORATE GOVERNANCE
Information required by this Item regarding the Company’s executive officers, directors and corporate governance, including information with respect to our corporate governance guidelines, Code of Business Conduct and Ethics and beneficial ownership reporting compliance, will appear in the Proxy Statement we will deliver to our stockholders in connection with our 2021 Annual Meeting of Stockholders. Such information is incorporated herein by reference.
ITEM 11. EXECUTIVE COMPENSATION
The information required by this Item will appear in the Proxy Statement we will deliver to our stockholders in connection with our 2021 Annual Meeting of Stockholders. Such information is incorporated herein by reference.
ITEM 12. SECURITY OWNERSHIP OF CERTAIN BENEFICIAL OWNERS AND MANAGEMENT AND RELATED STOCKHOLDER MATTERS
The information required by this Item regarding security ownership of certain beneficial owners and management will appear in the Proxy Statement we will deliver to our stockholders in connection with our 2021 Annual Meeting of Stockholders. Such information is incorporated herein by reference. Information relating to securities authorized for issuance under the Company’s equity compensation plans is included in Part II of this Annual Report under “Item 5–Market for Registrant’s Common Equity, Related Stockholder Matters and Issuer Purchases of Equity Securities.”
ITEM 13. CERTAIN RELATIONSHIPS AND RELATED TRANSACTIONS, AND DIRECTOR INDEPENDENCE
The information required by this Item will appear in the Proxy Statement we will deliver to our stockholders in connection with our 2021 Annual Meeting of Stockholders. Such information is incorporated herein by reference.
ITEM 14. PRINCIPAL ACCOUNTANT FEES AND SERVICES
The information required by this Item will appear in the Proxy Statement we will deliver to our stockholders in connection with our 2021 Annual Meeting of Stockholders. Such information is incorporated herein by reference.
73
part IV
ITEM 15. EXHIBITS AND FINANCIAL STATEMENT SCHEDULES
|
(a) |
The following are filed with this Annual Report: |
|
|
(1) |
Financial Statements. See Item 8 of this Annual Report on Form 10-K. |
|
|
(2) |
Financial Statement Schedules. Not applicable |
|
|
(3) |
Exhibits. See Exhibit Index listed in Item 15(b) hereof for a list of those exhibits filed as part of this Annual Report on Form 10-K or incorporated by reference. |
|
(b) |
Exhibits: |
EXHIBIT INDEX
|
Exhibit |
|
Description |
|
3.1 |
|
|
|
3.2 |
|
|
|
4.1* |
|
|
|
10.1 |
|
|
|
10.2 |
|
|
|
10.3 |
|
|
|
10.4† |
|
|
|
10.5† |
|
|
|
10.6† |
|
|
|
10.7† |
|
|
|
10.8† |
|
|
|
10.9† |
|
|
|
10.10† |
|
|
|
10.11† |
|
|
|
10.12† |
|
|
|
10.13† |
|
|
|
10.14+ # |
|
|
|
10.15+ |
|
|
|
10.16+ # |
|
|
|
10.17+ |
|
74
|
10.18+ |
|
|
|
10.19+ # |
|
|
|
10.20+ |
|
|
|
10.21+ |
|
|
|
10.22+ # |
|
|
|
10.23+ |
|
|
|
10.24+ # |
|
|
|
10.25+ # |
|
|
|
10.26+ # |
|
|
|
10.27+ # |
|
|
|
10.28+ |
|
|
|
10.29+ # |
|
|
|
10.30+ |
|
|
|
10.31+ |
|
|
|
10.32+ # |
|
|
|
10.33+ |
|
|
|
10.34+ # |
|
|
|
10.35 |
|
75
|
10.36+ # |
|
|
|
10.37+ # |
|
|
|
10.38+ # |
|
|
|
10.39+ # |
|
|
|
10.40+ # |
|
|
|
10.41+ # |
|
|
|
10.42+ # |
|
|
|
10.43+ # |
|
|
|
10.44+ # |
|
|
|
10.45+ # |
|
|
|
10.46+ # |
|
|
|
10.47+ # |
|
|
|
10.48+ # |
|
|
|
10.49+ # |
|
|
|
10.50+ |
|
|
|
10.51+ # |
|
|
|
10.52+ |
|
|
|
10.53+ |
|
|
|
10.54+ # |
|
76
|
10.55+ # |
|
|
|
10.56+ |
|
|
|
10.57# |
|
|
|
10.58+ # |
|
|
|
10.59 |
|
|
|
10.60+ # |
|
|
|
10.61+ # |
|
|
|
10.62+ |
|
|
|
10.63 |
|
|
|
10.64+ # |
|
|
|
10.65+ # |
|
|
|
10.66+ # |
|
|
|
10.67 |
|
|
|
10.68+ |
|
|
|
10.69+ # |
|
|
|
10.70+ # |
|
|
|
10.71+ |
|
|
|
10.72† |
|
|
|
10.73† |
|
77
|
10.74*† |
|
|
|
10.75*† |
|
|
|
21.1* |
|
|
|
23.1* |
|
|
|
31.1* |
|
|
|
31.2* |
|
|
|
32.1** |
|
|
|
101 |
|
The following financial information from Guild's Annual Report on Form 10-K for the year ended December 31, 2020 formatted in Inline XBRL (Extensible Business Reporting Language) includes: (i) the Consolidated Balance Sheets, (ii) the Consolidated Statements of Income, (iii) the Statements of Changes in Stockholders’ Equity, (iv) the Consolidated Statements of Cash Flows, and (v) Notes to the Consolidated Financial Statements |
|
104 |
|
Cover Page Interactive Data File - (formatted as Inline XBRL and contained in Exhibit 101) |
|
* |
Filed herewith. |
|
** |
The certifications attached hereto are not considered “filed” for purposes of Section 18 of the Securities Exchange Act of 1934 or otherwise subject to the limitations of that section. |
|
† |
Indicates management contract or compensatory plan. |
|
+ |
Certain portions of this exhibit have been redacted pursuant to Item 601(b)(10)(iv) of Regulation S-K. The omitted information is not material and would likely cause competitive harm to the registrant if publicly disclosed. The Company agrees to furnish supplementally a copy of any omitted schedule or exhibit to the Securities and Exchange Commission upon its request. |
|
# |
Certain schedules and exhibits have been omitted pursuant to Item 601(a)(5) of Regulation S-K. The Company agrees to furnish supplementally a copy of any omitted schedule or exhibit to the Securities and Exchange Commission upon its request. |
ITEM 16. FORM 10-K SUMMARY
None
78
SIGNATURES
Pursuant to the requirements of Section 13 or 15(d) of the Exchange Act of 1934, the registrant caused this Annual Report to be signed on its behalf by the undersigned, thereunto duly authorized.
|
|
|
GUILD HOLDINGS COMPANY |
|
|
|
|
|
|
|
Dated: March 23, 2021 |
|
By: |
/s/ Mary Ann McGarry |
|
|
|
Name: |
Mary Ann McGarry |
|
|
|
Title: |
Chief Executive Officer |
Pursuant to the requirements of the Securities Exchange Act of 1934, this Annual Report has been signed below by the following persons on behalf of the registrant and in the capacities and on the dates indicated.
|
Signature |
|
Title |
|
Date |
|
|
|
|
|
|
|
/s/ Patrick J. Duffy |
|
Chairman of the Board of Directors |
|
March 23, 2021 |
|
Patrick J. Duffy |
|
|
|
|
|
|
|
|
|
|
|
/s/ Mary Ann McGarry |
|
Chief Executive Officer |
|
March 23, 2021 |
|
Mary Ann McGarry |
|
(Principal Executive Officer) and Director |
|
|
|
|
|
|
|
|
|
/s/ Desiree A. Elwell |
|
Chief Financial Officer |
|
March 23, 2021 |
|
Desiree A. Elwell |
|
(Principal Financial Officer and Principal Accounting Officer) |
|
|
|
|
|
|
|
|
|
/s/ Terry L. Schmidt |
|
President and Director |
|
March 23, 2021 |
|
Terry L. Schmidt |
|
|
|
|
|
|
|
|
|
|
|
/s/ Edward Bryant, Jr. |
|
Director |
|
March 23, 2021 |
|
Edward Bryant, Jr. |
|
|
|
|
|
|
|
|
|
|
|
/s/ Martha E. Marcon |
|
Director |
|
March 23, 2021 |
|
Martha E. Marcon |
|
|
|
|
|
|
|
|
|
|
|
/s/ Michael C. Meyer |
|
Director |
|
March 23, 2021 |
|
Michael C. Meyer |
|
|
|